05
Jan
Category Archives: CaucasusBarometer
05
Jan
Bribery in 2012
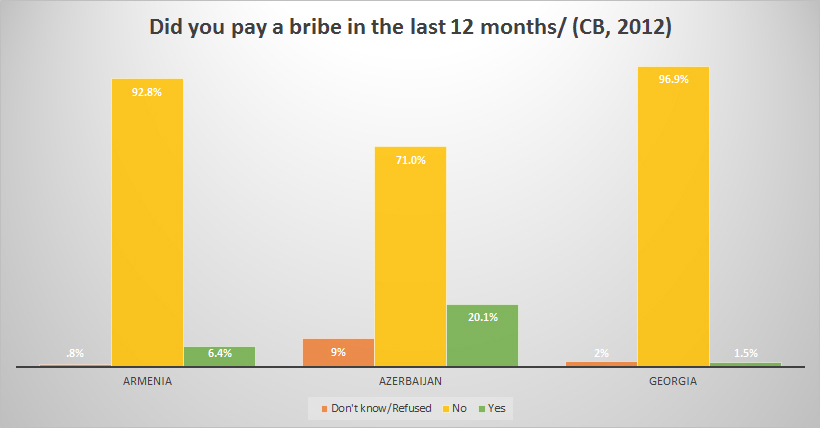
I have nothing to say.
30
Dec
Trust and Gender in the Caucasus
I wrote a blog post a few weeks ago about interpersonal trust (using EBRD data). One of my arguments is that Azerbaijanis have very low interpersonal trust. After a conversation with a girlfriend, I had the idea to look at gender differences in trust as well. This is with CRRC data.
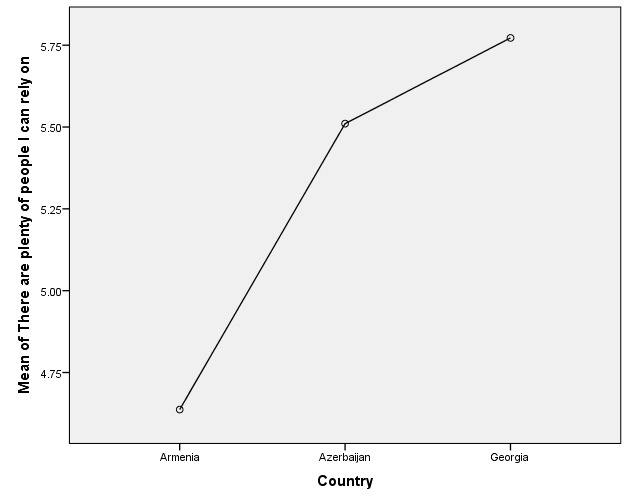
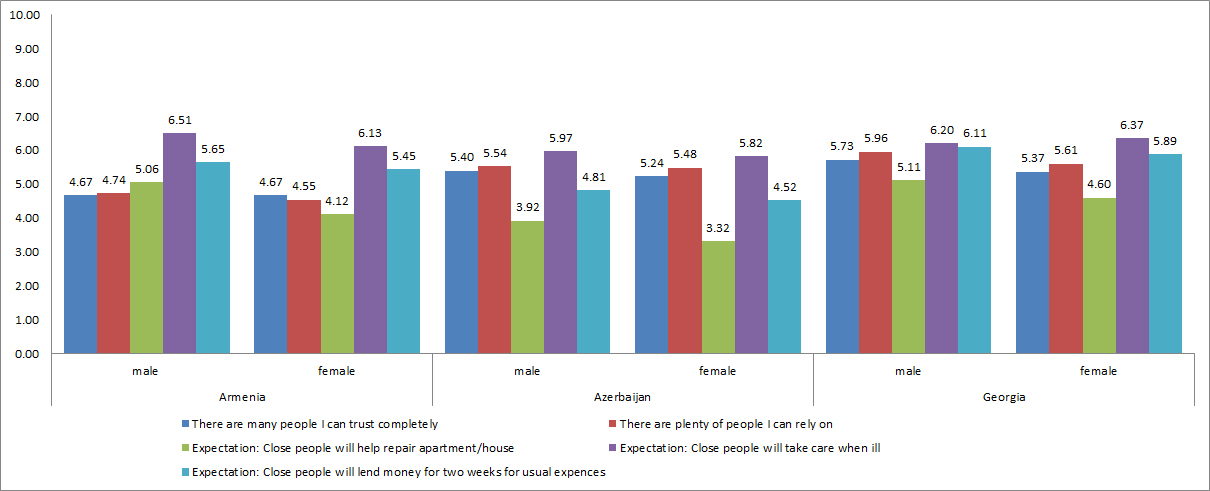
First, without gender, you can see that generally Azerbaijanis have much lower trust in others than Armenians or Georgians do, but this varies by question. (These are on a 1-10 scale with 1 not trust, 10 trust completely or 1 total disagree and 10 totally agree).
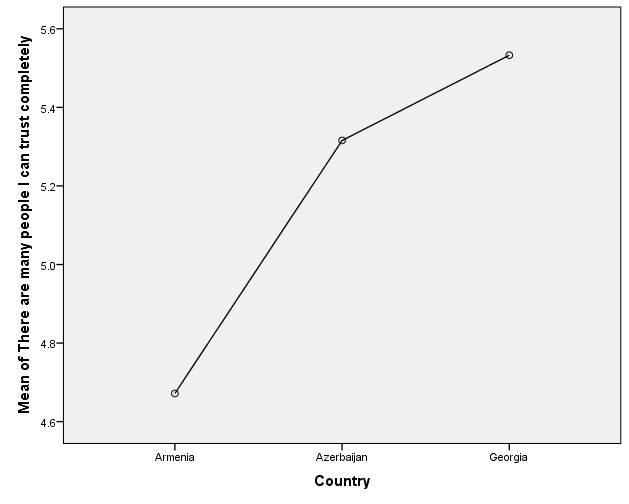
In this next chart with gender, you can see gender differences in a variety of questions related to interpersonal trust. The only time that there was no significant difference in trust between men and women is for Armenians with the question “there are many people I can trust completely” – otherwise all these differences are significant.
But looking at the two extremes – completely agree and completely disagree, things are also interesting…
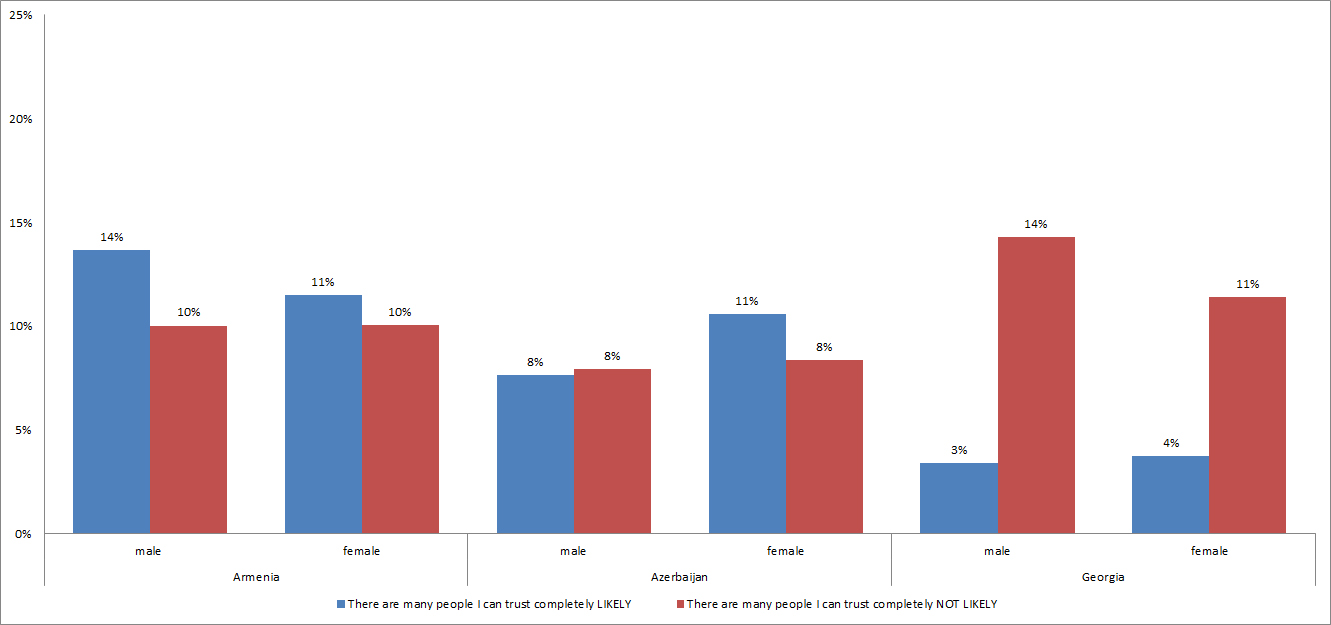
In this question of people that one can trust completely, Georgians seem to have it the worst, with only 3 or 4% having someone like that. Overall gender differences aren’t that stark in this question.
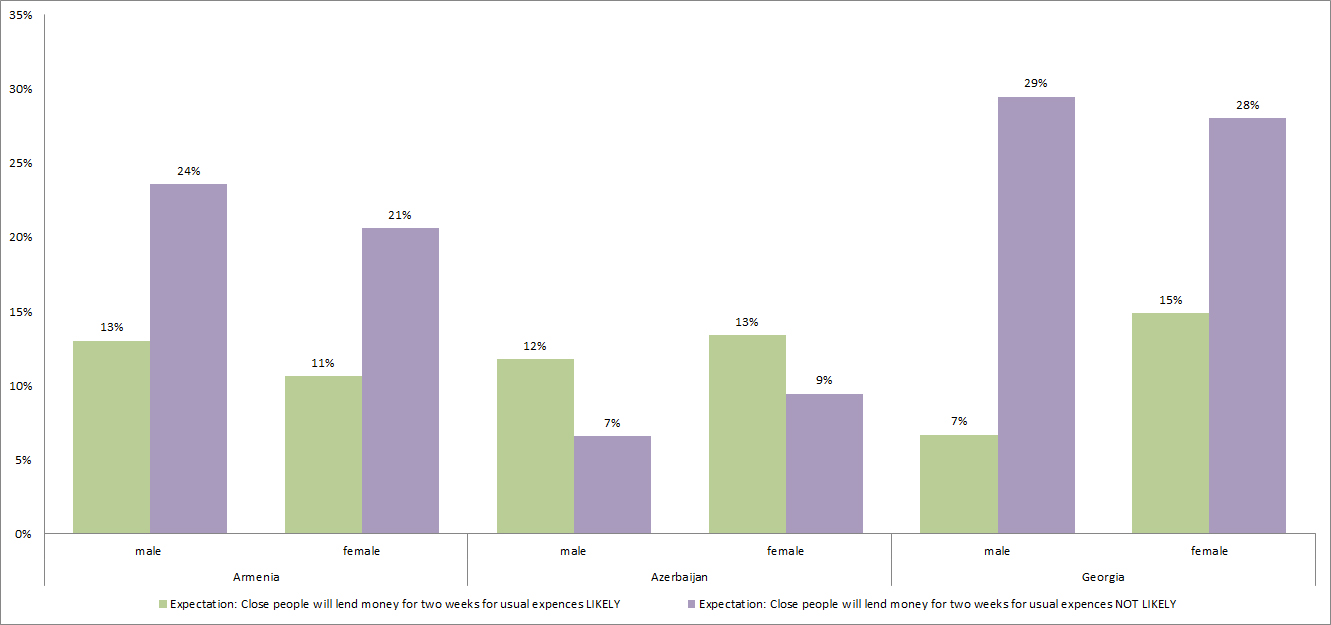
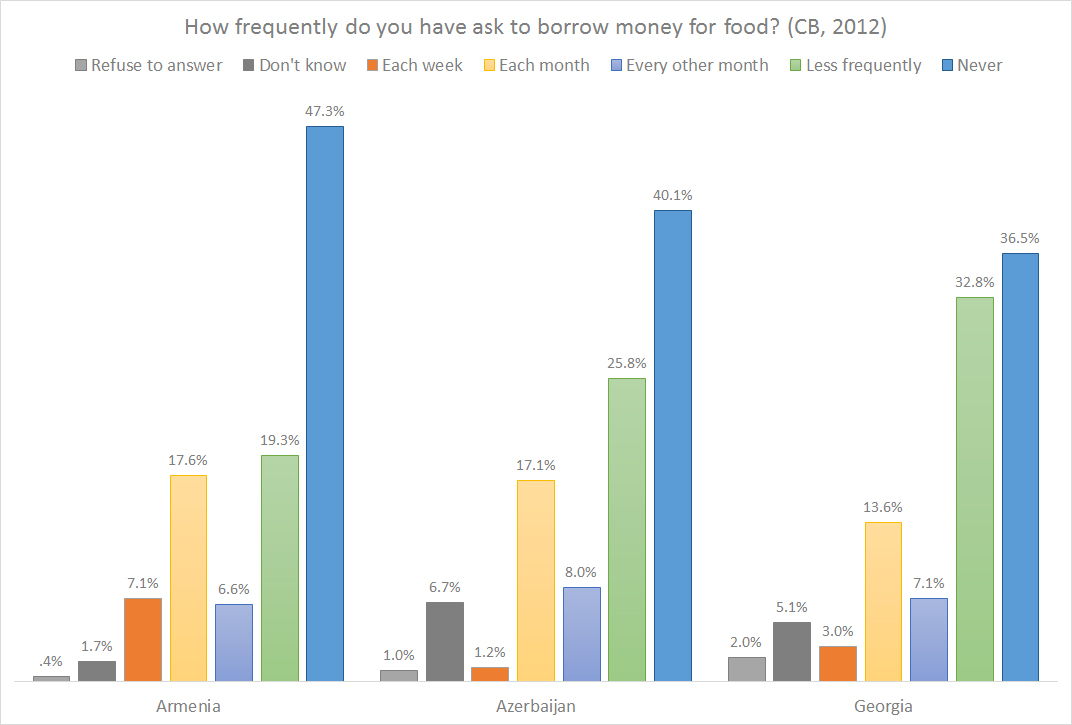
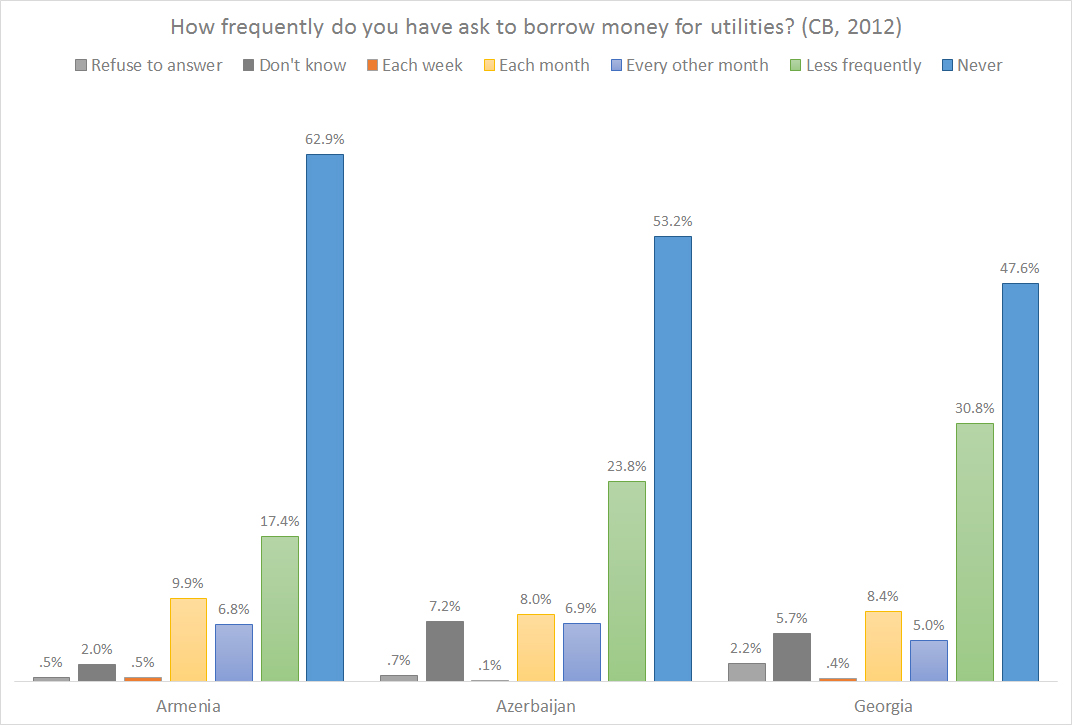
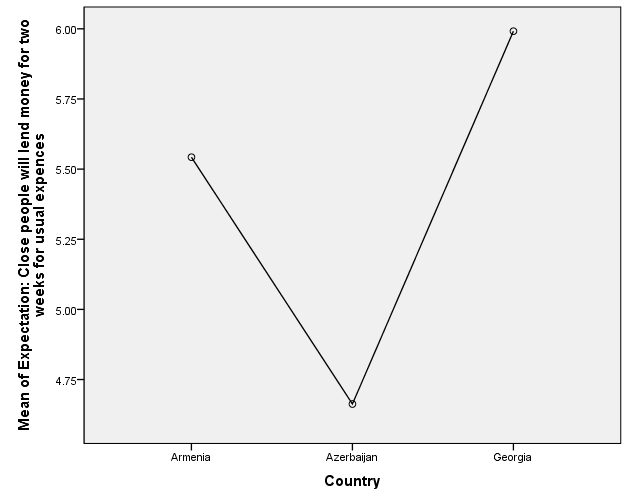
Here for money lending, big country differences. Georgians can’t get a break, huh? Gender differences here exist, but not too harshly.
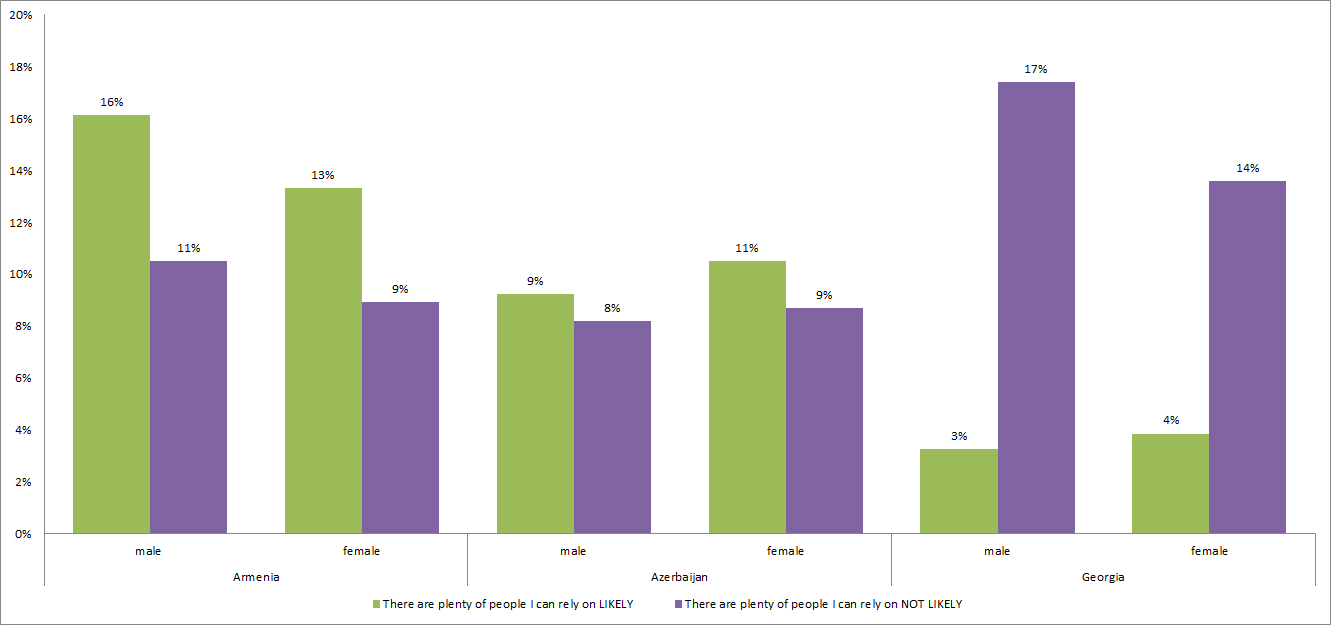
For reliable people, Georgians again are in a bad spot.
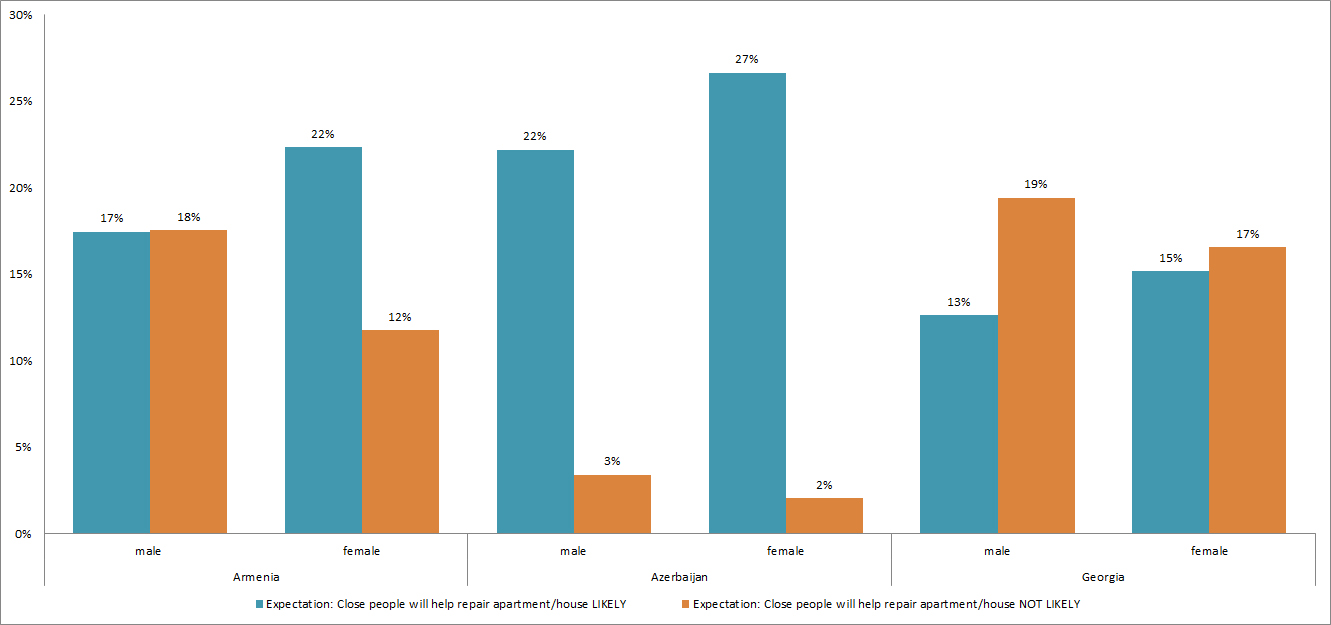
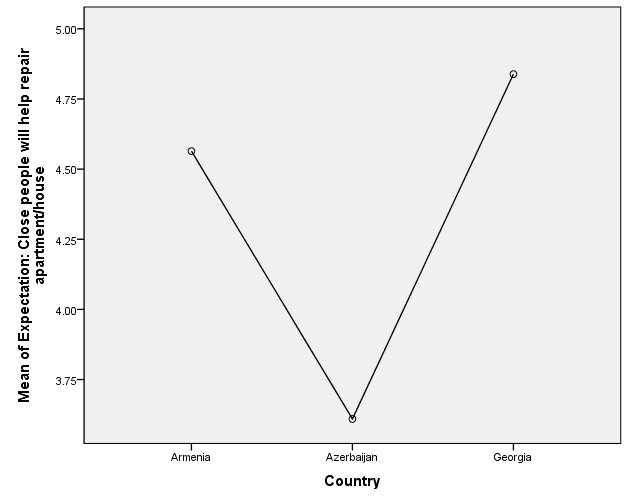
Help repair the apartment – well, this is a lot to ask of people, right? Georgians again are not doing well here.
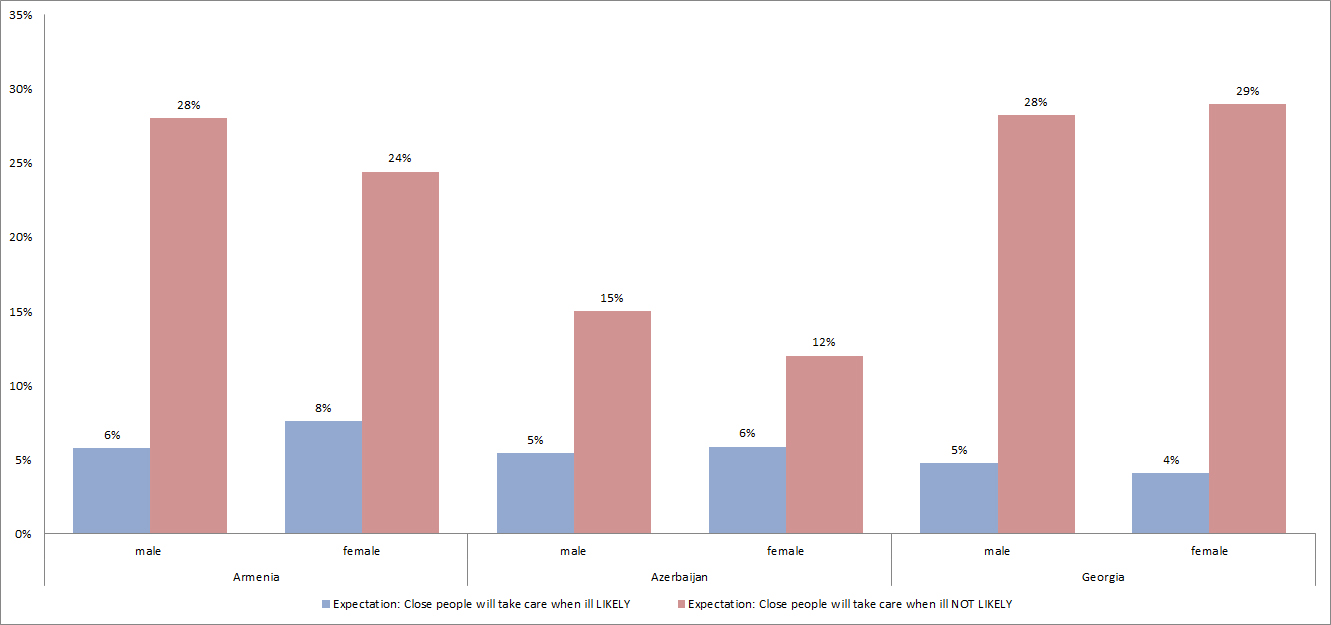
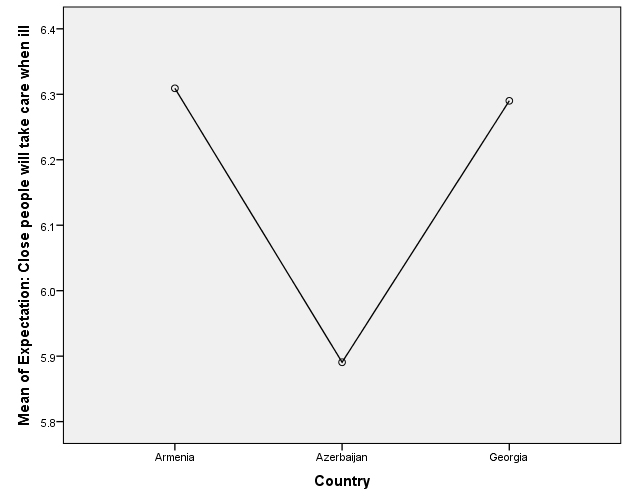
I don’t want to get sick in the Caucasus. Looks like people have trouble finding people to help care for them. Again, no major gender differences here.
So overall, despite there being a statistically significant difference in trust between genders, it doesn’t really manifest in these practical questions.
30
Dec
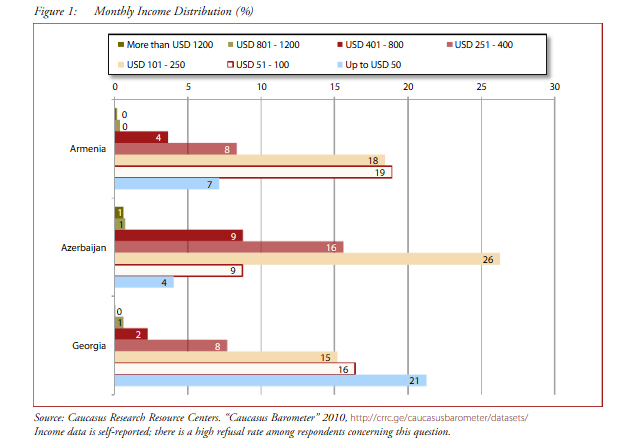
Material Deprivation in 2012
A few years ago I wrote a piece about measuring poverty in the South Caucasus.
That paper ended with 2010, but I was talking about it with someone yesterday, so I did some quick 2012 updates.
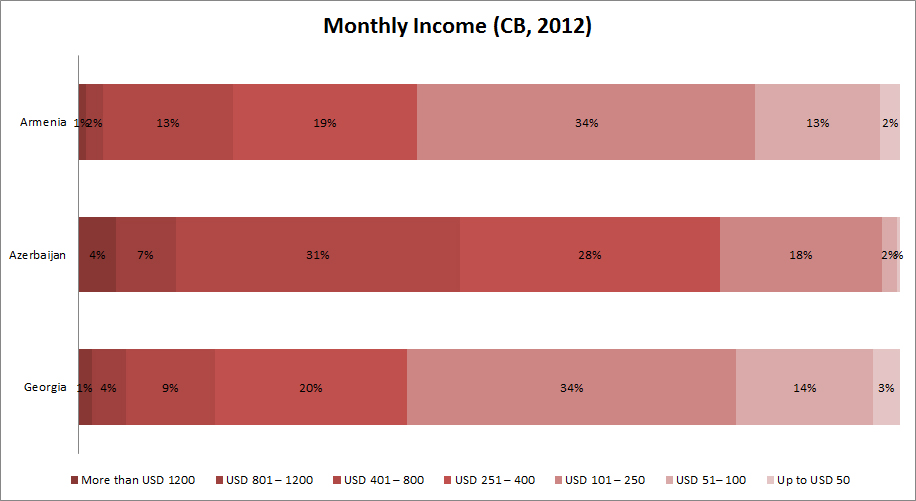
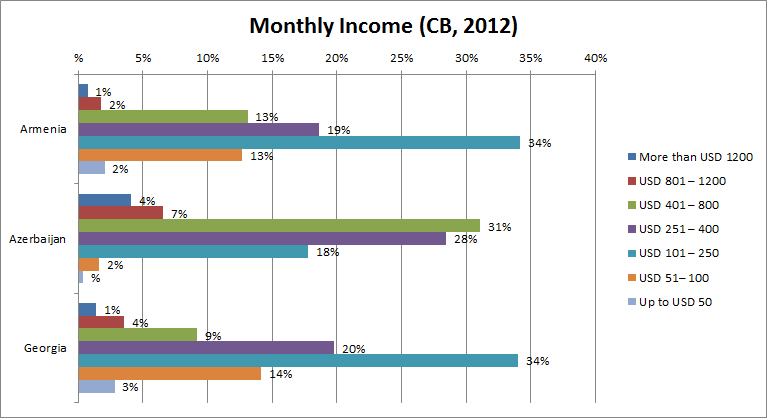
As far as monthly household income in 2012, the distribution hasn’t changed much since that 2010 paper, but you can see that Armenians and Azerbaijanis are doing much better economically.
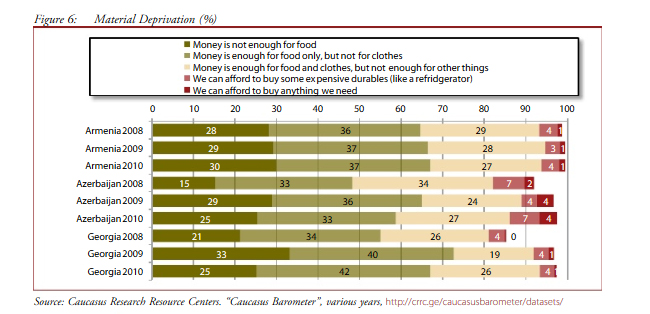
In the paper I argue that material deprivation is the best measure of economic wellbeing because it reflects household ability to buy consumer goods.
This is the 2009-2010 distribution of material deprivation:
And this is the 2012 update.
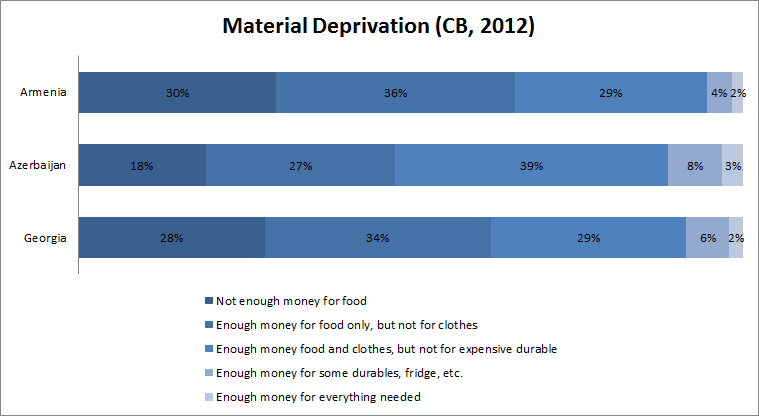
Armenia didn’t change much. Azerbaijan has less people at the poverty end of the scale, so that’s a positive change. Georgia had a bit of a change in more people in the enough for food category, but about the same in poorest category.
It is hard to see economic changes in such a short period of time – it would certainly be worthwhile to do some trend analysis here. Maybe next year!
12
Dec
Attitudes toward IDPs in Azerbaijan
Sometimes sitting around in a coffeeshop brings interesting ideas. While sitting with Jale Sultanli today, she speculated that IDPs in Azerbaijan hold different attitudes toward Karabakh than other Azerbaijanis. I, always the nerd, said LET’S TEST THIS!
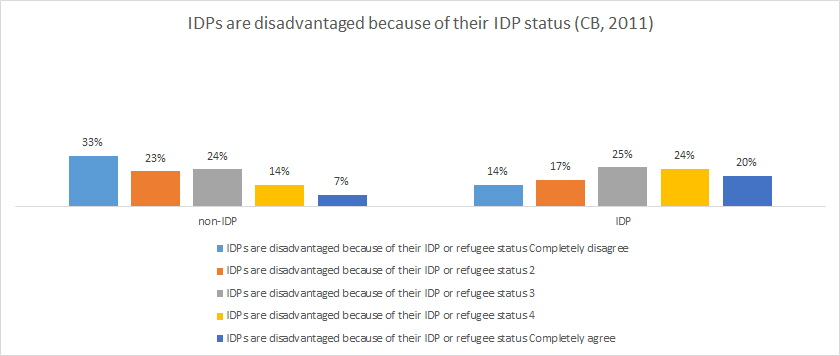
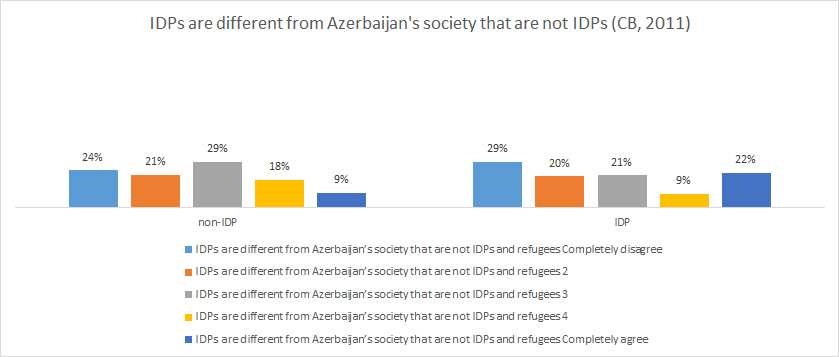
So we did a series of analyses comparing IDPs and non-IDPs. Here is the first set of attitudes – questions about IDPs’ role in society.
The first issue is – are IDPs disadvantaged. Unsurprisingly, IDPs believe they are more disadvantaged than non-IDPs believe they are. A third of non-IDPs think that IDPs are not disadvantaged at all.
But are IDPs different from other Azerbaijanis? This is more of a mixed bag. (And perhaps an odd question.) IDPs are mixed – 22% say they are completely different and 29% say not different at all. While most non-IDPs (29%) are in the middle on this.
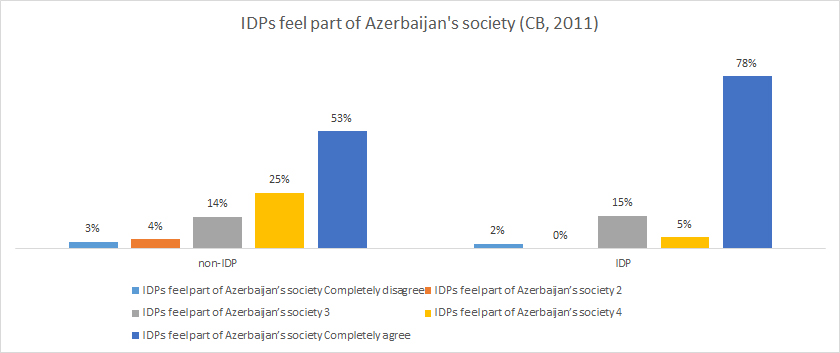
So, do IDPs feel that they are a part of Azerbaijan’s society? The IDPs themselves sure think so! Over three-quarters feel that they are completely part of the society. A little over half of non-IDPs believe so.
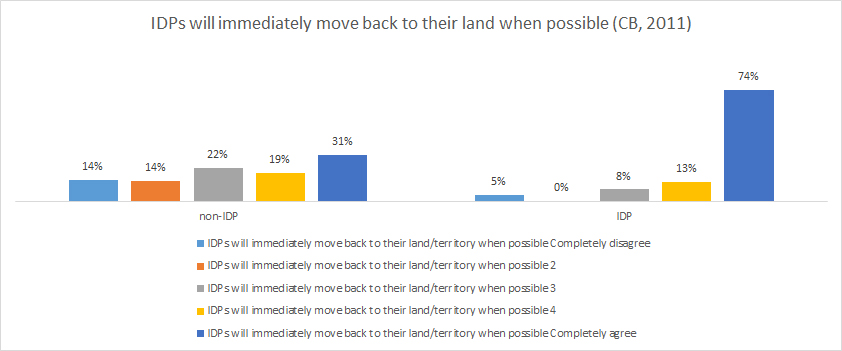
Jale told me that a lot of non-IDP Azerbaijanis think that IDPs don’t want to move back – they like their new digs more. However, according to this, this is just not true. Three-quarters of IDPs say they will immediately move back when possible. Whereas under a third of non-IDPs believe (completely) they the IDPs would move back.
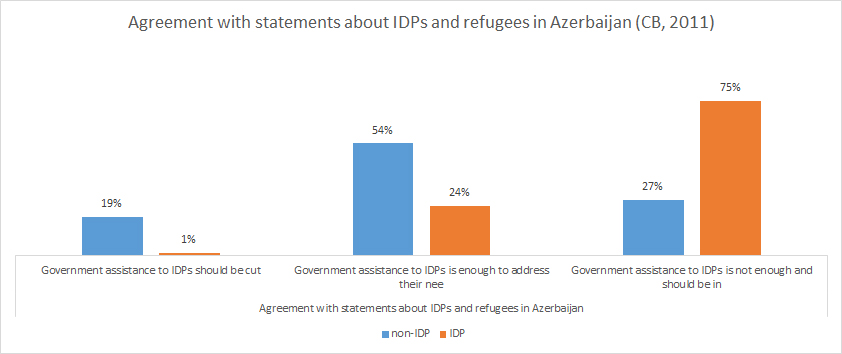
Some non-IDPs were unhappy (early on) that IDPs were coming to Baku, so there may be lingering concerns about the amount of support that the IDPs receive. Moreover, some Azerbaijanis feel that IDPs perhaps are taking advantage of the support they receive by not working. Unsurprisingly, three-quarters of IDPs feel that the government should be supporting them more. While a little over a quarter of non-IDPs feel this way. 19% of non-IDPs feel that the government assistance should be cut.
15
Sep
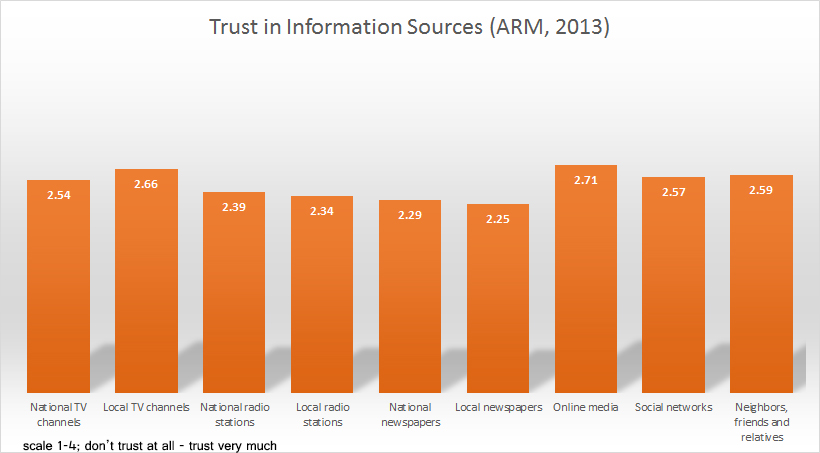
Media trust in Armenia – a methodological mess
A few years ago I wrote a report summarizing a USAID-funded CRRC-conducted study of the Armenian media environment. They re-did this study this summer (no report seems to be available yet), but the data is up so I will be slowly but surely posting some findings.
Let’s start with media trust.
This graphic makes it appear that Armenians trust online media more than any other source of media. Wow! Go Internet!
But when you look at the frequencies, you see that Armenians were pretty ambivalent about answering questions on media trust. More than a third said that they didn’t know for every type except interpersonal (neighbors, friends, and relatives), local TV, and national TV. And many had “not applicable” (which I take to mean that they don’t consume that type of media). For what it’s worth, if don’t knows are higher than 10%, generally the question is considered “questionable.”
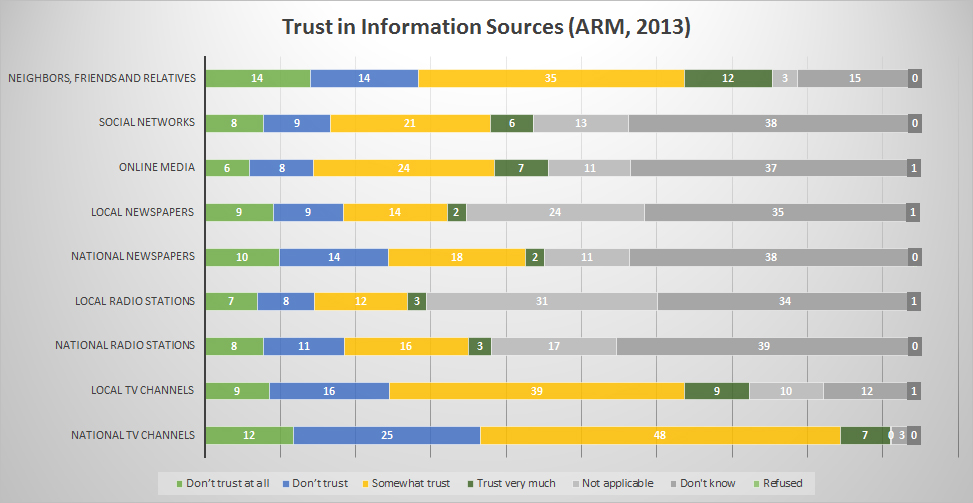
This is why even though I LOVE online data analysis tools, I get a little nervous about people just jumping in and making conclusions without understanding how surveys and statistics work.
More posts on this data to come!
10
Aug
Attitudes toward protest over time
(I did a quick blog post on this earlier this year, FWIW)
Attitudes toward protest is one of my favorite Caucasus Barometer questions.
(Sarah Kendzior and I wrote a piece centered around this measure in 2012).
It is an interesting way to ask a question in a vignette format.
People are asked which statement they agree with and degree.
* Very much agree: People should participate in protest actions against the government, as this shows the government that the people are in charge.
* Agree: People should participate in protest actions against the government, as this shows the government that the people are in charge.
* Neither
* Agree: People should not participate in protest actions against the government, as it threatens stability in our country.
* Very much agree: People should not participate in protest actions against the government, as it threatens stability in our country.
* Don’t know
And of course they can refuse to answer.
statement 1:
People should participate in protest actions against the government, as this shows the government that the people are in charge.statement 2:
People should not participate in protest actions against the government, as it threatens stability in our country.
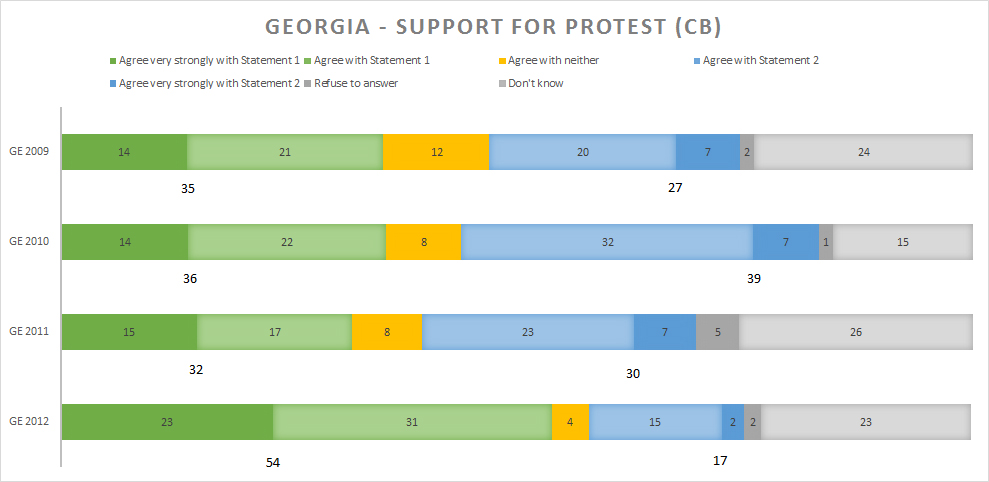
Wow – Georgia in 2012 was really interesting. Of course the Caucasus Barometer was collected in the middle of a huge election, so this likely explains the jump from a stable one-third to over half supporting people protesting in one year.
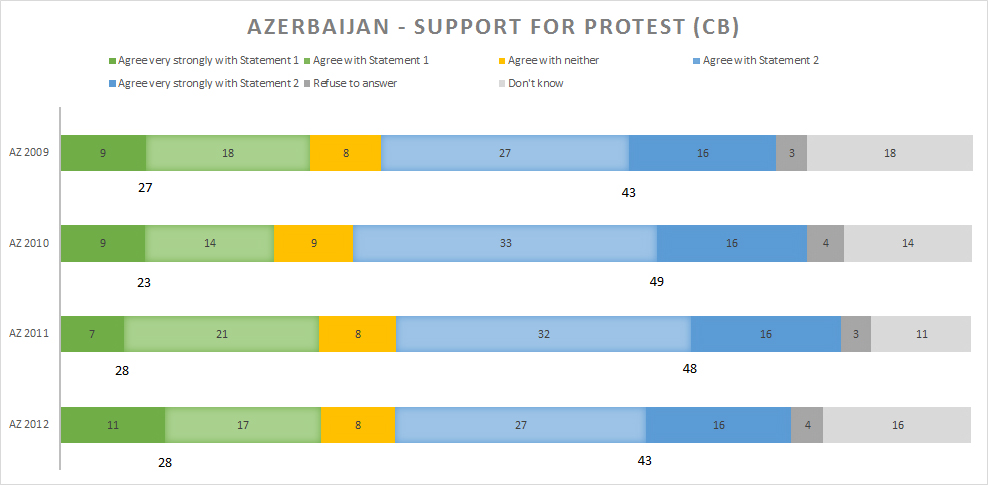
Attitudes toward protest in Azerbaijan are fairly stable, with about a quarter of the population thinking that it is okay to protest and 43-49 percent thinking that it is not okay. The “don’t knows” and “refuse to answer” are pretty high in Azerbaijan — which could reflect fear, masking, or ignorance.
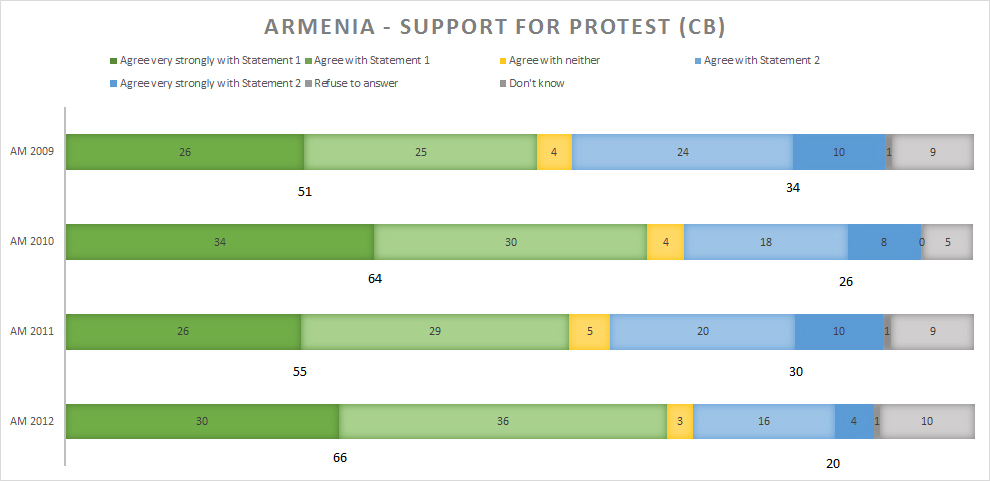
Between half and two-thirds of Armenians feel that protest is a good thing. And between 20-34 percent of Armenians don’t think that people should protest. A pretty low percentage had no opinion in the matter. The Caucasus Barometer is collected in the late fall. With the 2008 presidential election issue and the early 2013 presidential election issue, during which some protesting occurred, one must wonder if these protests and the response to them had an effect on public opinion.
—–
I was curious who these supporters and non-supporters are (I only did this on the 2012 data).
Armenians that refused to ansawer were highly educated and more urban.
Armenians that answered “don’t know” were wealthier.
Armenians that supported protests were wealthier and more interested in discussing politics.
However, Armenians that didn’t support protests were also wealthier and more interested in discussing politics.
Azerbaijanis that refused to answer were more urban, frequent Internet users, and wealthier, as well as more likely to discuss politics with friends.
Azerbaijanis that said that they didn’t know were more rural and wealthier.
Azerbaijanis that supported protests were more urban, more likely to discuss politics, and wealither, as well as female.
Azerbaijanis that didn’t support protests were also more urban, wealthier, and discuss politics.
In Georgia, those that support protest are more urban, better educated, and more willing to discuss politics.
06
Aug
Let’s have a data party
Last year I wrote a blog post about triangulating different data sources. I used the example of mobile phone ownership and the ITU, Caucasus Barometer, and Gallup. In that post I said:
“The point I’d like to make is that these statistics are complicated and it is hard to get at the “right” number. That’s why we try to triangulate — look at different sources of data to see if things seem right. We also should always assess the credibility of the source of the data.
Data sources:
ITU is the UN’s official statistics and these numbers come from the governments themselves who usually get the numbers from the telecommunications companies. These companies count number of SIM cards sold and it is not unusual for people to have multiple SIM cards. This is data to be highly skeptical about. For the question about mobile penetration, this isn’t actually percent, it is number of mobile phones per 100 people.
Caucasus Barometer, Gallup, and EBRD are surveys taken face-to-face in households. All use different sampling techniques and are collected by different organizations. None are perfect, but they’re as good as we’ve got. Of the three, I trust Gallup the least.
Noteworthy:
All of these were collected at different times of the year.
Margin of error varies in all of these.
A ~4-6 point difference is within the margin of error and shouldn’t be looked at with too much suspicion.”
With those same rules applying, here are some results from different sources from Azerbaijan.
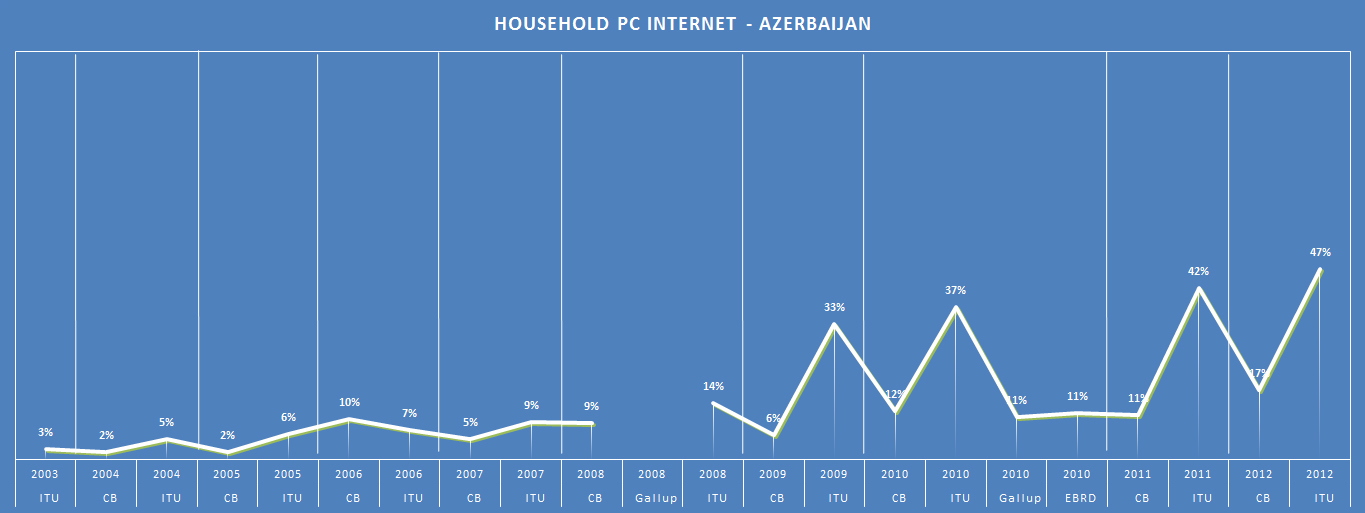
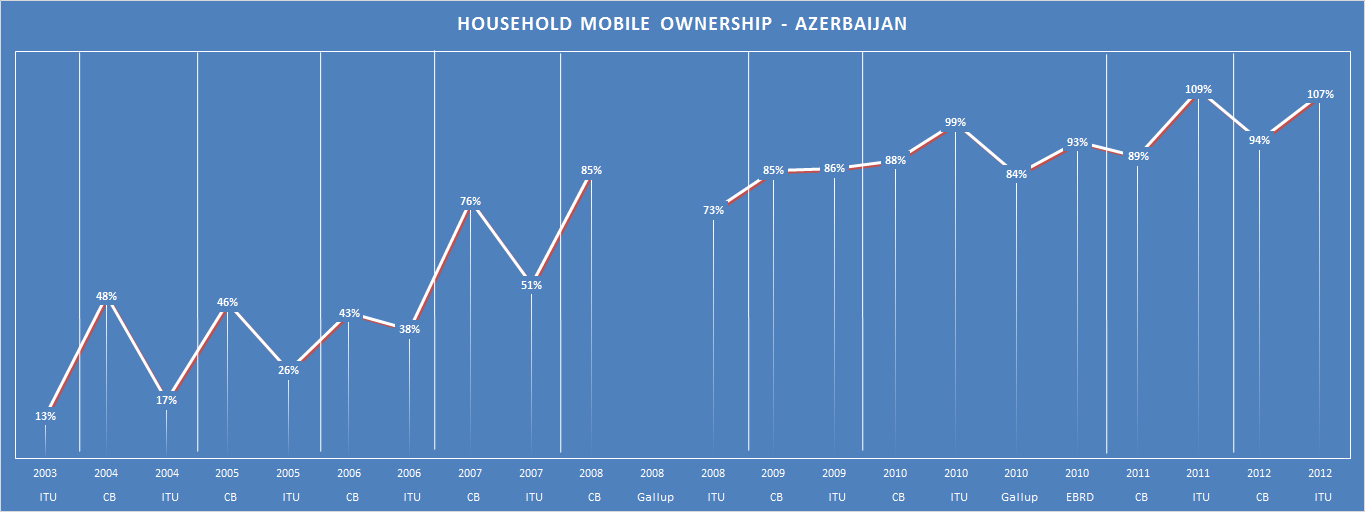
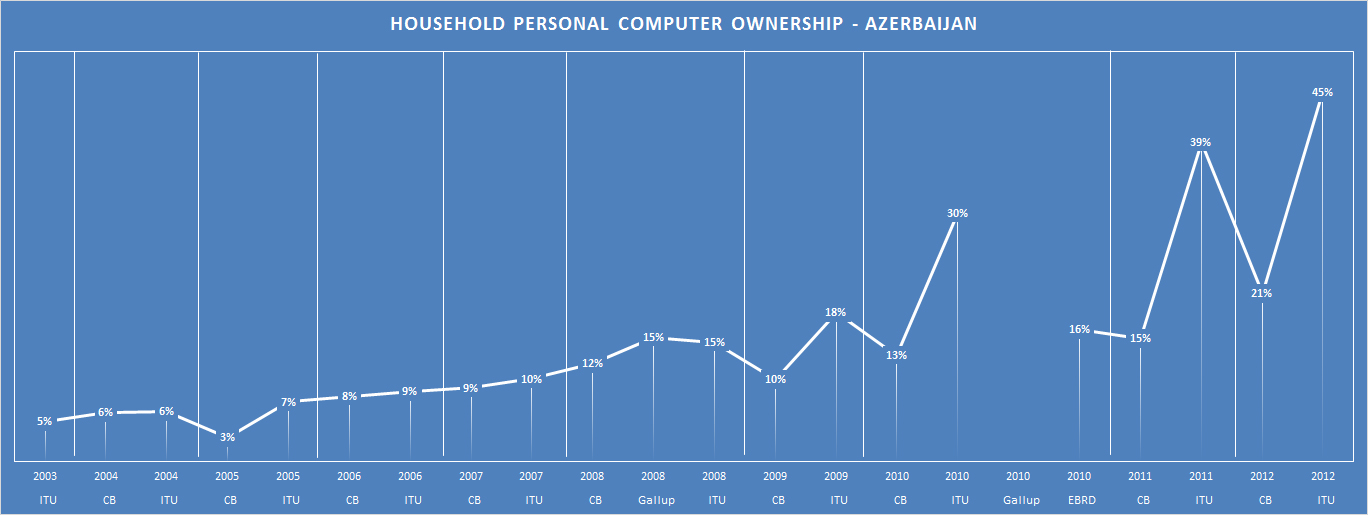
For what it is worth, I LOVE having more data. The more data we have measuring similar things, the more sure we can be of the results. 2010 is a great year here because of the 4 data sources (for some questions). But please, reach your own conclusions about what the “correct” percentage is.
PPS, here is a similar comparison of Armenia’s statistics from a few years ago. And here’s one for Armenia specifically on mobile comparison.
07
Mar
Azerbaijan Gender Issues Online
In honor (?) of March 8, a blog post on gender…
Last year I did quite a bit of work on gender and Internet in Azerbaijan. Here are two blog posts [1] [2]. Like in 2011, in 2012, there are almost no gender differences in Armenia or Georgia, so there is no need to write about it.
First, looking at frequency.
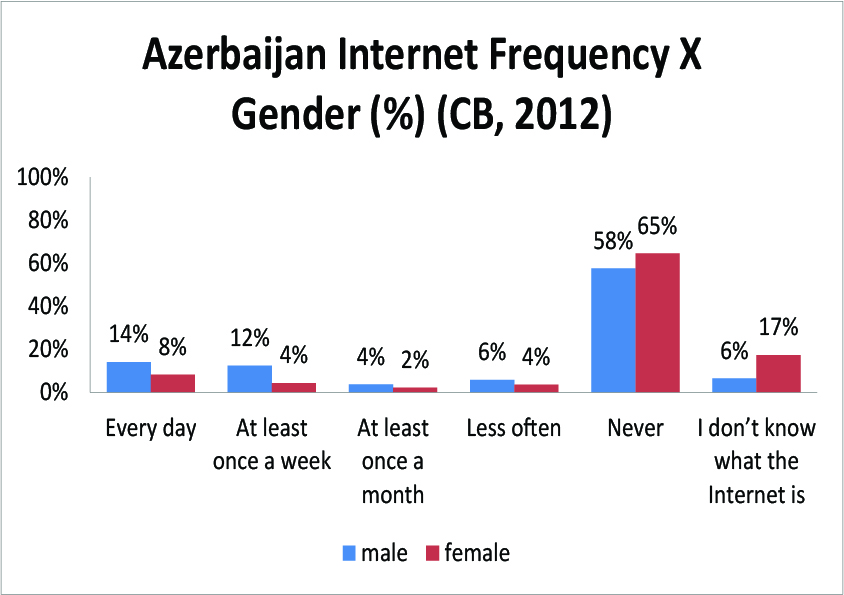
While 14% of Azerbaijani men are online every day, only 8% of women are. While 58% of Azerbaijani men never go online (even though they are aware of the Internet), 65% of Azerbaijani women never go online (although they are aware of the Internet), and 17% of Azerbaijani women and only 6% of Azerbaijani men do not know what the Internet is.
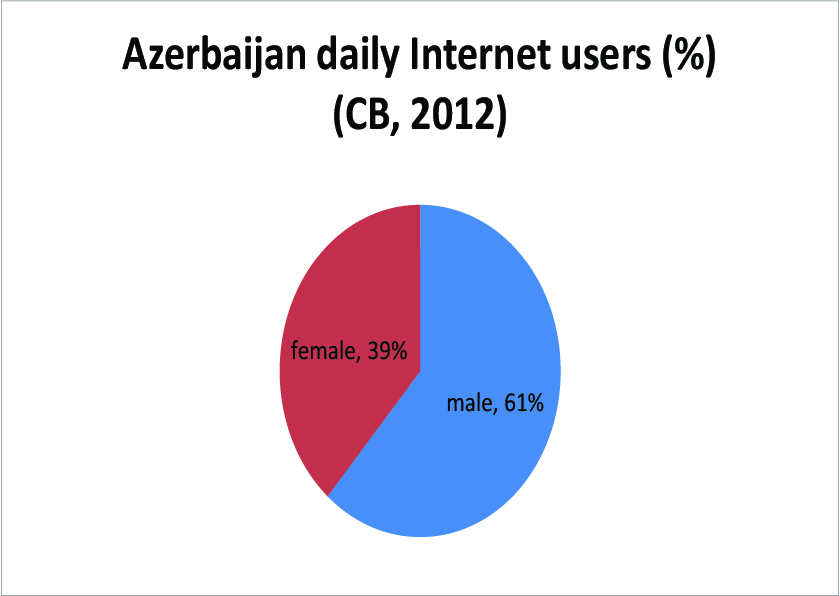
61% of daily Internet users in Azerbaijan are men. Last year this was 73% to 27%, so this is an improvement in equality.
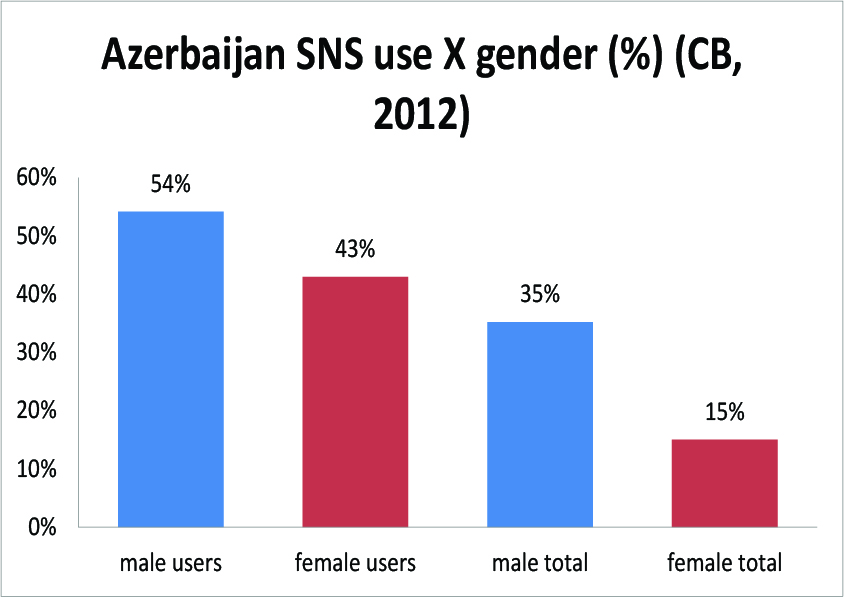
54% of male Internet users in Azerbaijan are on a social networking site and 43% of female Internet users in Azerbaijan are on a social networking site. However, because of the low percentage of women online, only 15% of all female Azerbaijanis are on a social networking site, while 35% of all male Azerbaijanis are.
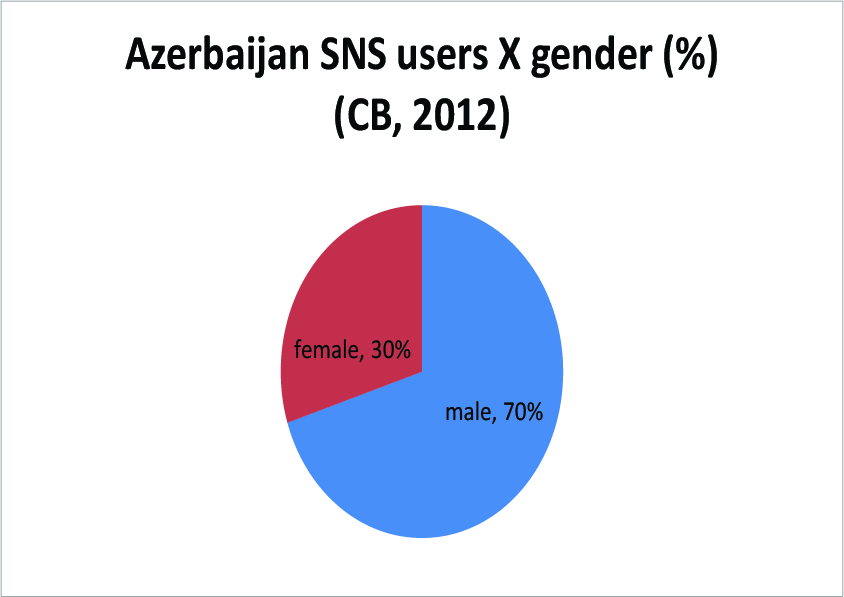
Men make up 70% of social networking site users in Azerbaijan in 2012. In 2011, men were 72% of Facebook users in Azerbaijan, so this is not a major change.
17
Feb