30 Apr

WVS: Is homosexuality justifiable? – entire world – map

I’ve written before about how difficult it is to measure attitudes toward homosexuality. But nonetheless, with the new World Values Survey out this week, I looked at some global comparisons asking is homosexuality ever justifiable (in this case 1 = never justifiable, 10 = always justifiable) and here are the results. Take them with a grain of salt because there is such a strong issue with social desirability here:

Here are the means:

hsjst

And methodology notes.

29 Apr

WVS: Media Use – Azerbaijan

More on methodology here.

The WVS media use questions are essentially useless (sorry WVS!) for my research. They ask about frequency of use as an information source and then use of a personal computer. However, since sometimes some people question my analyses about technology use in the Caucasus, these can provide a datapoint from an alternative source.

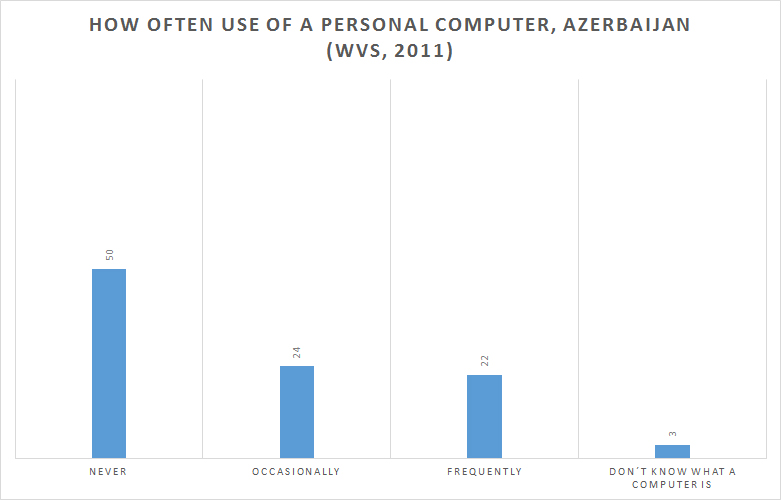
So first, lets look at personal computer use in Azerbaijan.

As of late 2011, 50% of Azerbaijani adults never used a personal computer and less than a quarter used one frequently. (Although I looked at “size of town” and those living in places with over 500,000 residents were slightly higher with 32% using frequent, 25% using occasionally, and 42% never using.) Note that the Caucasus Barometer has 15% of households owning a personal computer in 2011 (and obviously some people use at work), but the ITU says 39% of Azerbaijani households had a PC in 2011. The WVS makes the ITU data look questionable (again).

pc1

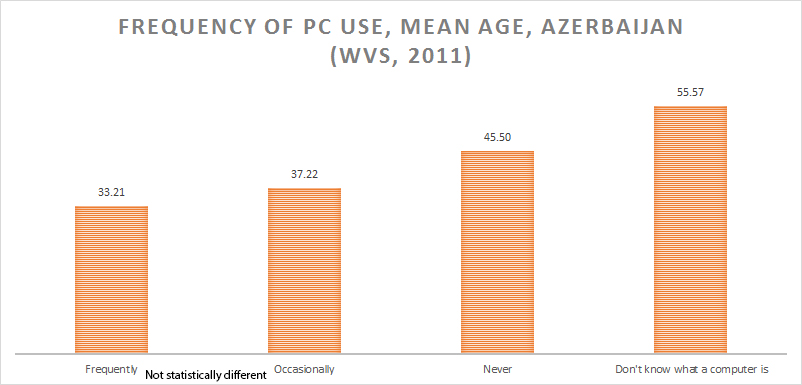
I also looked at the average age of each of these categories.

meanagepc


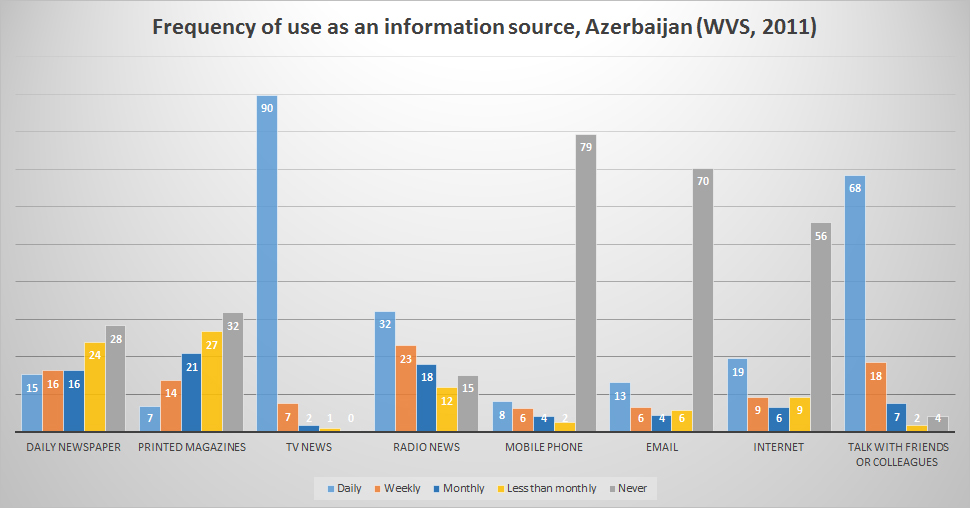
Then looking at information sources, 70% of Azerbaijani adults never got information from email and 56% never got information from the Internet. 19% of Azerbaijanis did get information from the Internet daily though and 44% had used the Internet for information.
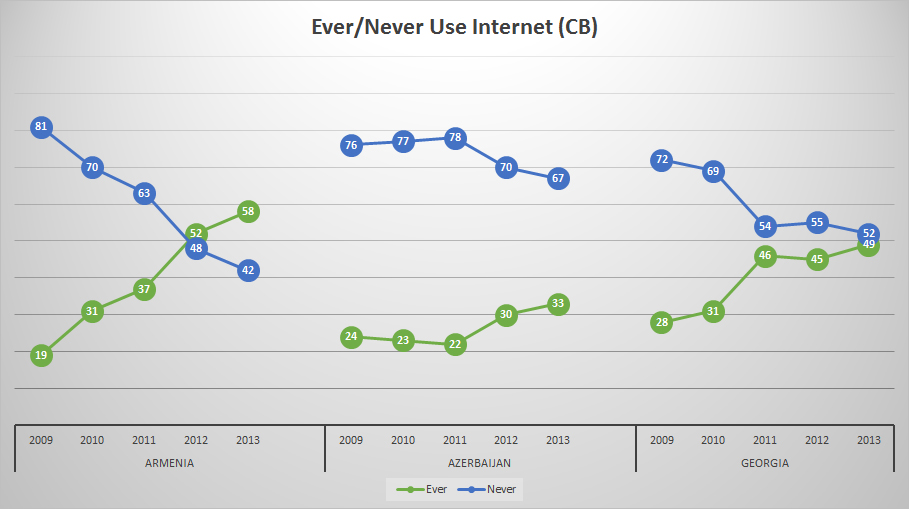
The Caucasus Barometer from CRRC in 2011 found that 22% of Azerbaijani adults had ever used the Internet, so that sort of lines up with this WVS data. Maybe it is possible that people are getting information FROM the Internet, but not directly? (Grandson tells Grandmother about some news he read online?). The ITU says that in 2011 42% of Azerbaijani households had PC-based Internet. Given that some people have Internet at work, this doesn’t really line up perfectly as well.

infosource

I looked at age as well and for most of these, there are no age differences. Internet does differ between ages, with the average “never” using the Internet person being 45.98 years and then the average daily user being 32.43 and the other categories being in the middle of those in their 30s. Otherwise the differences were small or none at all.

28 Apr

WVS: Trust in others – Azerbaijan and world

More on methodology here.

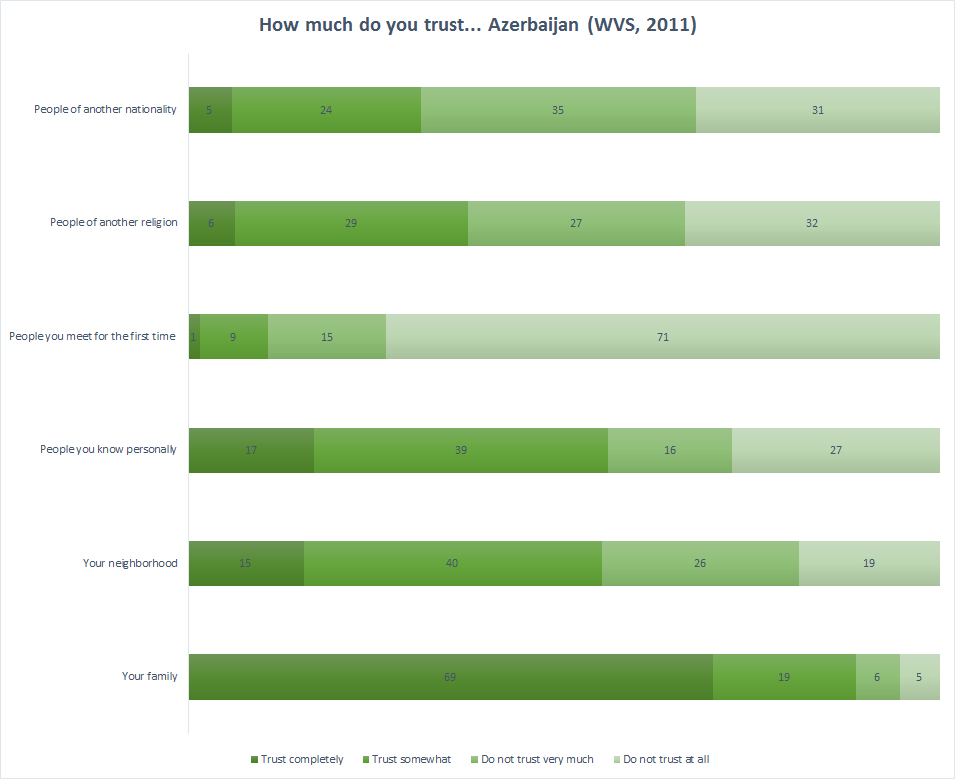
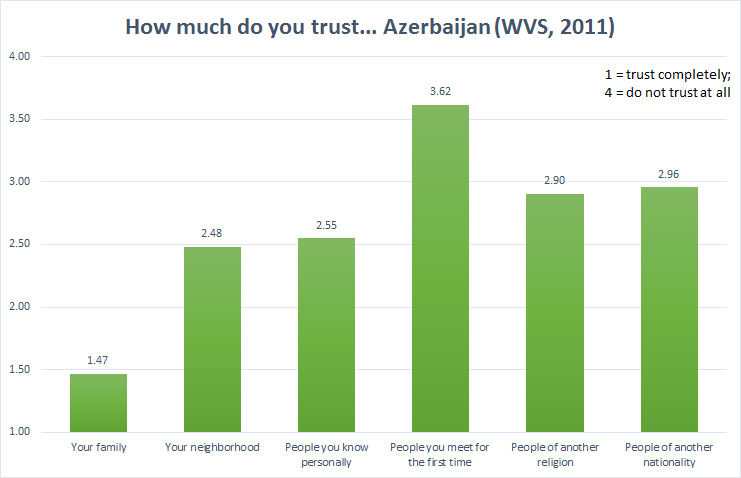
I’m currently working on 2 different papers that deal with trust of others in Azerbaijan, so I was very excited to see this. As per what literature says, Azerbaijanis have very low trust in strangers and very high trust in family.

freq

means


And here’s the means of the world. Again, 1 is high trust and 4 is no trust. Azerbaijan has very poor trust in strangers compared to the globe

world

28 Apr

New World Values Survey is out

The World Values Survey is a large international survey, conducted every few years with a variety of cooperating organizations. In their words: it “is a global research project that explores people’s values and beliefs, their stability or change over time and their impact on social and political development of the societies in different countries of the world.” This wave included Armenia and Azerbaijan and they hadn’t been done in years, so I was very happy.

Most of the time they do a pretty good job measuring things. Sometimes I don’t LOVE their measures, but what can you do? Also the media use measures are far too limited for my work, so I don’t really use this too much professionally. But I will do some analysis on my blog for fun.

Note: there is an online data analysis tool, check it out!

The methods information is available here, but here is the information for the Caucasus.

In Armenia, conducted by CRRC, the data for this wave was collected in 2011 and is weighted against demographics. The sampling plan, gathered from the electricity lists, was:

The stratified two stage cluster sample using PPS methodology was employed, using the following stages:
(a)Stratification: The approach of stratification of households (and, correspondingly, their members: respondents) by the regions/marzes of the country was applied to design the sample. The stratification is being considered as preferable option, as it allows ensuring representation of all heterogeneity of objective social, economic, cultural and other characteristics of the sampling units located in different geographic areas/regions of the country. At the same time, it ensures quite internal homogeneity of the aforementioned characteristics within each stratum. Therefore, all households in the sample frame were devised into 11 strata by the regional criterion (Capital – Yerevan and 10 regions/marzes). At the same time, in each stratum the second level of stratification was carried out: urban and rural, in order to obtain the urbanrural proportions of the households at the regional and country levels. The same principle of the PPS stratification was applied also within the capital: Yerevan. There are some 7 districts in Yerevan, which were determined as sub-strata within Yerevan and the total number of households in each district of Yerevan in the sample is proportional to the general distribution of the households by these sub-strata.Thus, in total there are 28 separate strata and sub-strata, of which the selection of primary sampling units (PSUs) was carried out at first.
(b) Clusters (PSUs). Two-stage cluster sampling method was applied to the survey sample design. At the first stage of sampling procedure, clusters (city blocks) of households formed based on the sample frame were selected using SRS (simple random sampling) method. Approximately equal sized clusters of households were selected in each stratum. (c)Households (SSUs). At the second stage of the sampling procedure the secondary sampling units, i.e. households (SSUs) were selected in each already selected cluster, using the SRS method. In each selected PSU 20 SSUs were interviewed.
(d)Respondents (FSUs). In each selected household (SSU) the respondent/FSU (h/h member in the age group of 18-85) was selected using the recent birthday method.

For Azerbaijan, the data was collected by the International Center for Social Research and the data was collected in December 2011. Ages 18+.

Here’s the sampling plan:

11 economic regions of Azerbaijan were identified as initial strata. 100 PSUs were randomly selected with probability proportional to size of each strata, and then 12 persons were systematically selected in each PSU. The full list of election districts within each stratum were used for random selection of PSUs, and the full lists of voters within selected election districts were used for random selection of respondents. Both election districts (PSUs) and voters (respondents) were selected from the lists published on the official website of Central Election Commission of Azerbaijan (http://www.infocenter.gov.az ).
Thus, two-stage area probability sampling was applied:
(1) At the first stage – random selection of 100 PSUs proportionally to size of each strata;
(2) At the second stage – random selection of 12 respondents within each PSU.

21 Apr

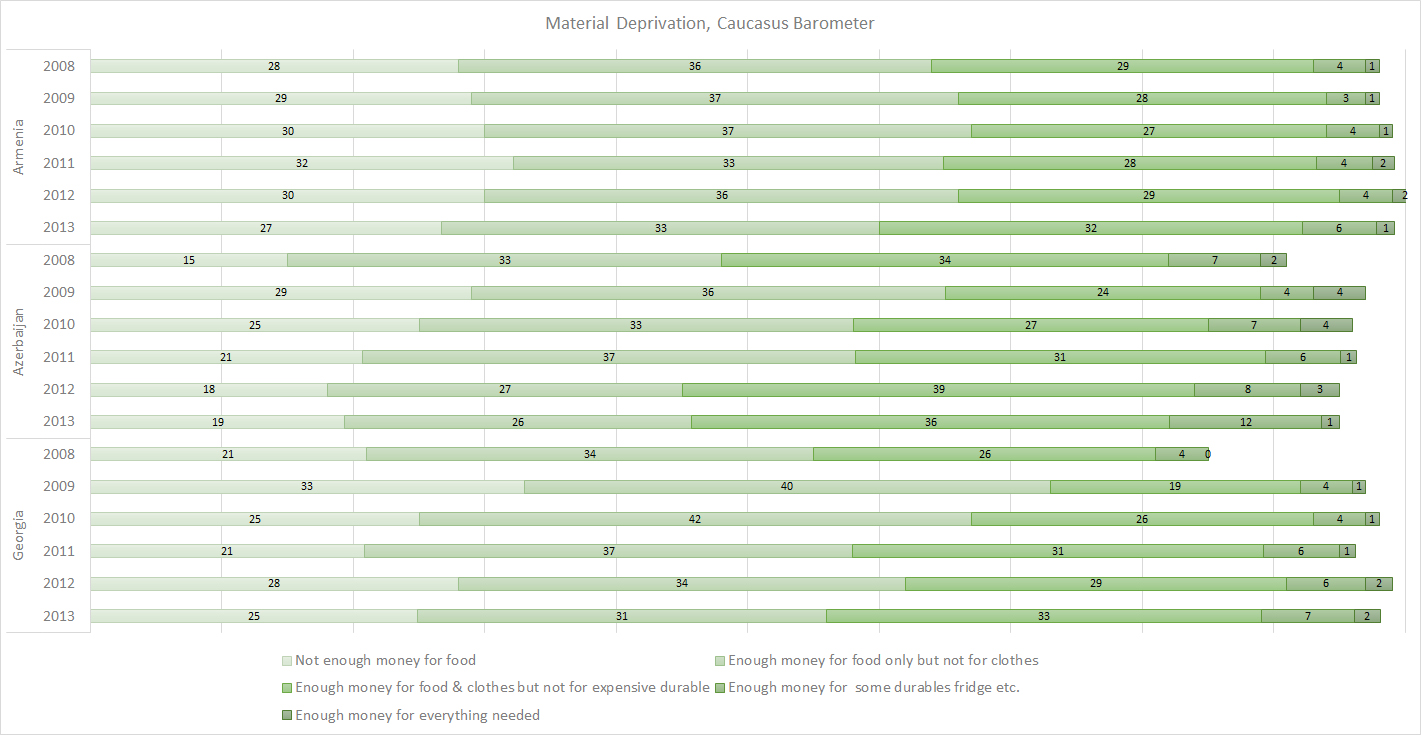
Material Deprivation 2013 update

Material deprivation

Although many studies use income as a single indicator of socioeconomic status, certainly income is not a complete or direct measure of total economic wellbeing (Falkingham, 1999; Ringen, 1998). We use a consensual poverty measure, where the greater the number of consumable items absent, the greater the degree of material deprivation (Demirchyan & Thompson, 2008; Menchini & Redmond, 2009; Nolan & Whelan, 1996; for an extensive review, see Ouellette, Burstein, Long, & Beecroft, 2004), or what Boarini and Mira (2006) call objective satisfaction of basic needs. These have been shown to be most appropriate in the post-Soviet context (Falkingham, 1999; Kandiyoti, 1999; Rose & Mcallister, 1996), as income is low, irregular, and often not official. The scale used here (described by Rose, 2002) asked “what phrase best describes your family’s financial situation” and provided five choices.

Here’s the past.

And here’s some comparison over time (not comparing means, just giving frequencies.

MDyears


09 Apr

Identification with local and global – Azerbaijan

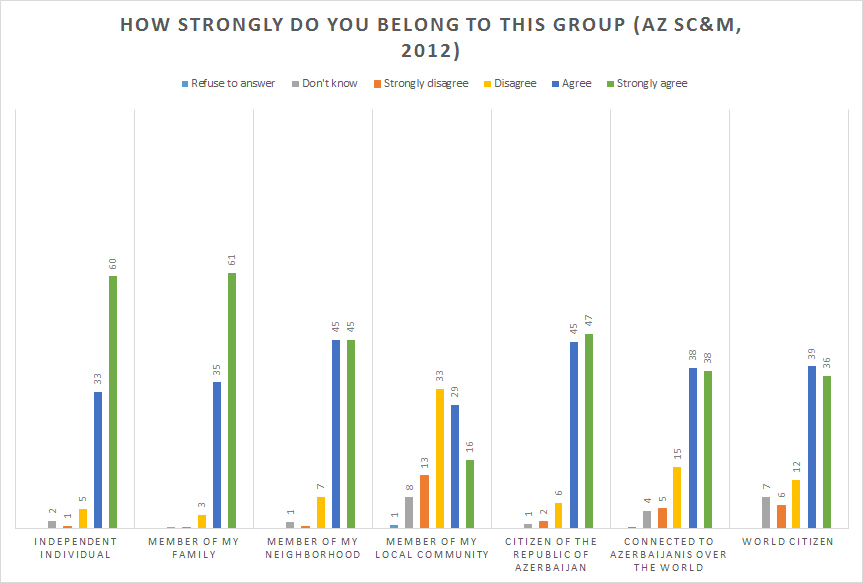
In the 2012 social networks and media survey done by CRRC in Azerbaijan, respondents were asked about belonging to various groups.

ident

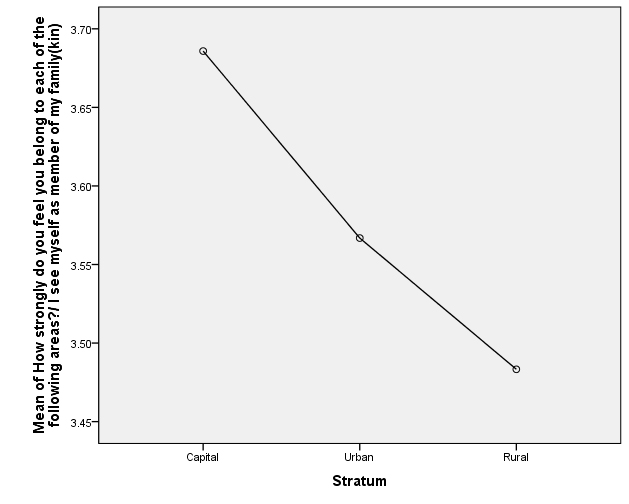
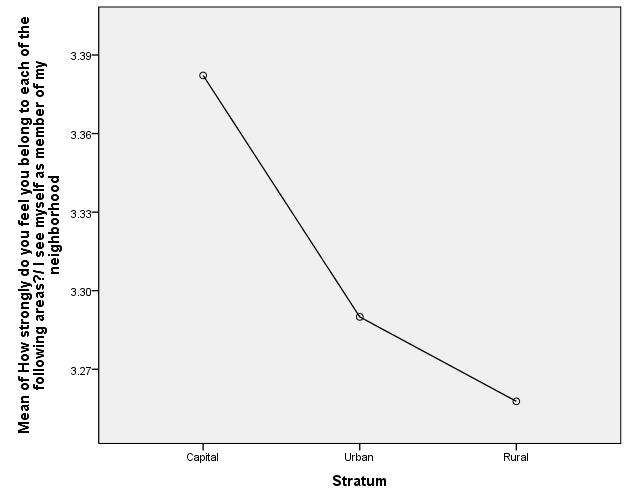
ETA: here’s the breakdown by region – Baku, regional cities, villages 1 = strongly disagree and 4 = strongly agree. All differences are statistically significant.

f

Capital and rural people much more likely to view themselves as independent people.

family

Identification with family is strongest in the capital and least important in rural areas? I need to think about this a bit.

e

Neighborhood identification is strongest in capital, then downward. Again, need to think about this.


d

Community/municipality is most important in rural area, least in capital.

c

Capital city people see themselves as citizens of the nation the most.

b

Not surprisingly, capital city people are the most connected to Azerbaijanis around the world.

a

And similarly, capital city people are the most globally oriented.