While figuring out technology penetration rates isn’t my main interest, people do ask me a lot.
I get nervous about giving percentages because I am more interested in demographic divides – gender, wealth, education, region, etc. And for the most part, giving penetrations rates doesn’t allow for that. (See here for more on this.)
But a journalist was asking today about Facebook users in Azerbaijan and I learned about a new way to find out how many Facebook users are in a country — through Facebook’s Ad selling programs. While I don’t totally trust this information (numbers are too round, this counts ever used, not current or regular users), it is interesting. ETA: But the numbers they give are not exact, so these percentages displayed below are not accurate for the true number of users. I calculated everything from the actual population. So when it says 36% of Georgian women are X, I calculated from the population data from the World Bank. This isn’t SOLID information, but it does come FROM Facebook, so it is a little bit better than SocialBakers.
This is what it looks like to find out this information:
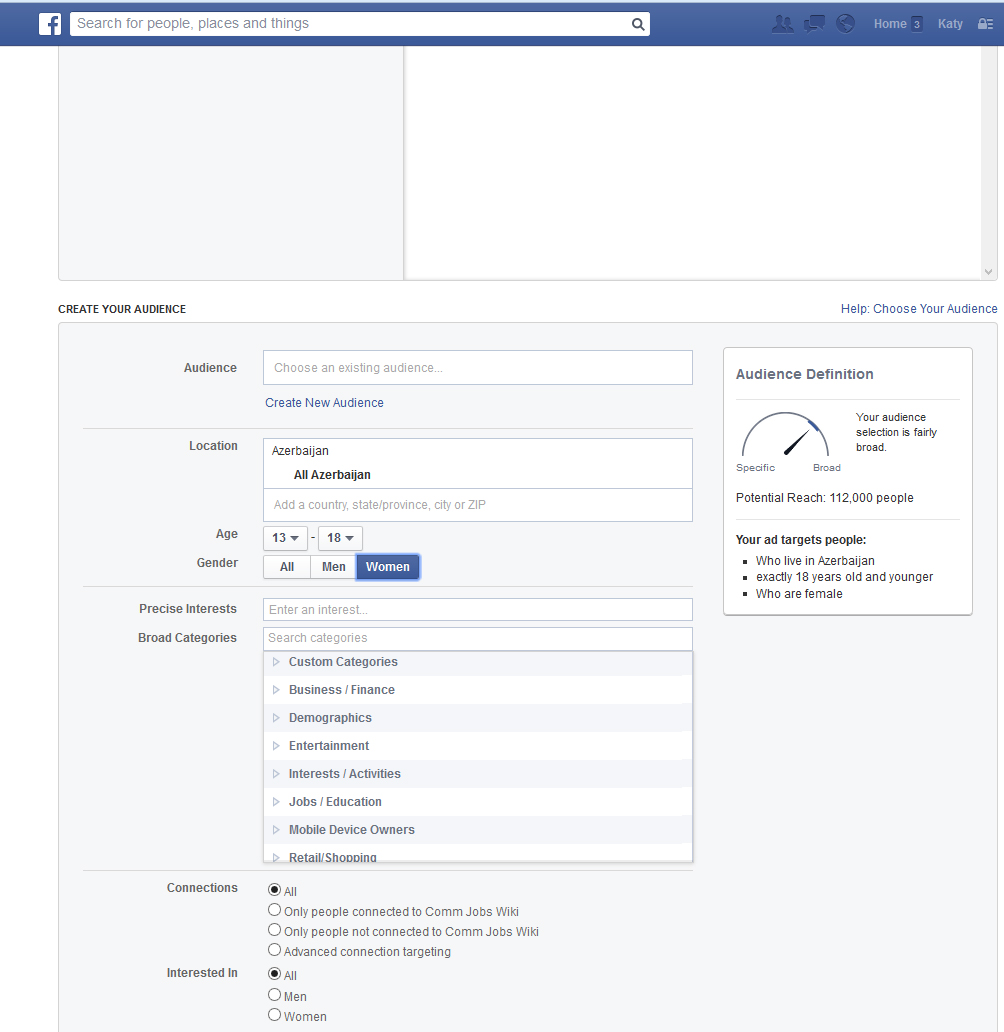
So, Armenia has 2,974,184 people, Azerbaijan 9,590,159 people, and Georgia 4,555,911 people total according to the World Bank and after I subtracted those age 0-14 (World Bank’s category, not mine) the populations are Armenia: 2,460,436; Azerbaijan: 7,419,487; Georgia: 3,855,233.
Facebook Ads says that this many people in each of those countries is a potential viewer of their ads (thus a Facebook user): Armenia: 580,000; Azerbaijan: 1,320,000; Georgia: 1,220,000 (for those that think this is a competition, Georgia is “winning”). Let us acknowledge that these numbers from Facebook are way too round, thus they are rough estimates. We can’t trust them completely. But let’s see what we have.
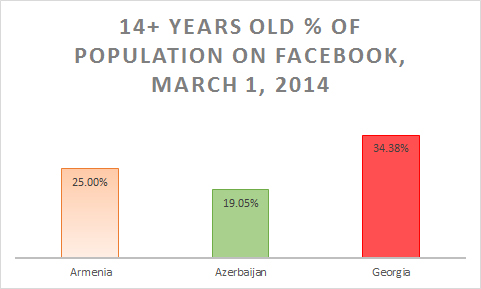
Thus, here are the percentages of the age 14+ populations of each country who are on Facebook:
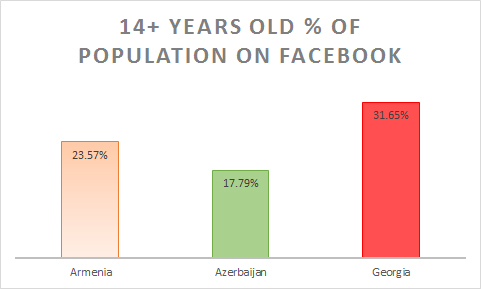
Armenia: 24%
Azerbaijan: 18%
Georgia: 32%
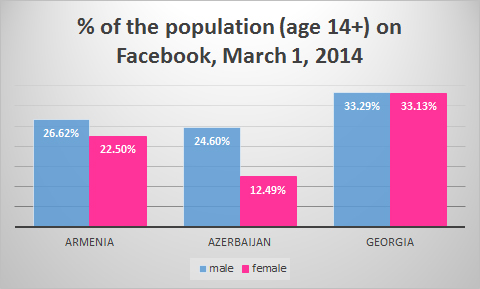
So that is interesting, but let us look at gender differences (I took the direct gender population data from the age distribution tables – this is not 50/50, but more accurate).
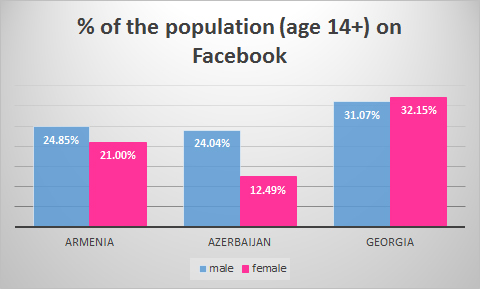
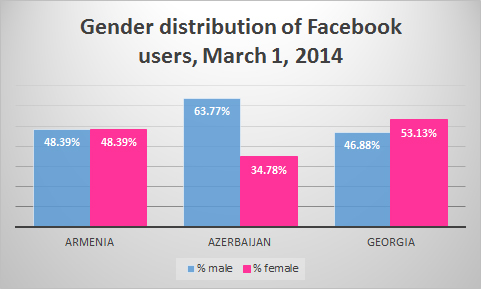
Armenians and Georgians are evenly distributed gender-wise on Facebook. And Azerbaijanis, well, this gender difference isn’t surprising.
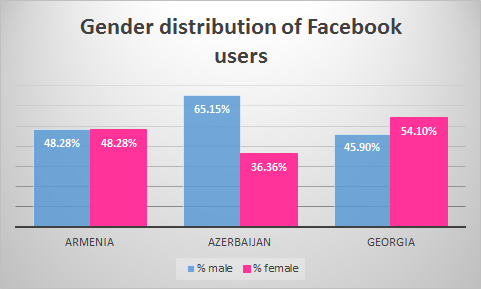
In terms of the balance of users, Armenians are fairly even, Georgians have about 10% more women and you can see that about 2/3rds of Azerbaijanis on Facebook are men. Although this may seem shocking, this is much better than it has been in previous years.
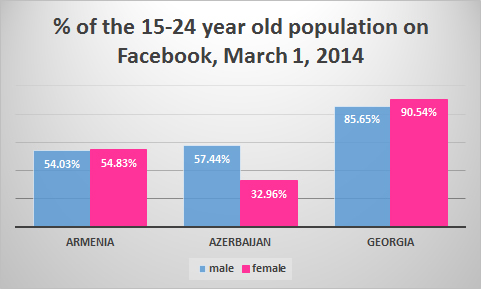
A category that the World Bank uses is ages 15-24 and we know that 18% of Armenians and Azerbaijanis and 14% of Georgians are in that age range – I again used the raw numbers from the World Bank to calculate these.
|
Armenia |
Azerbaijan |
Georgia |
| ages 15-24 |
280000 |
780000 |
540000 |
| male 15-24 |
136000 |
500000 |
260000 |
| % to pop |
0.50332 |
0.552317 |
0.795326 |
| female 15-24 |
134000 |
280000 |
280000 |
| % to pop |
0.524821 |
0.329551 |
0.905431 |
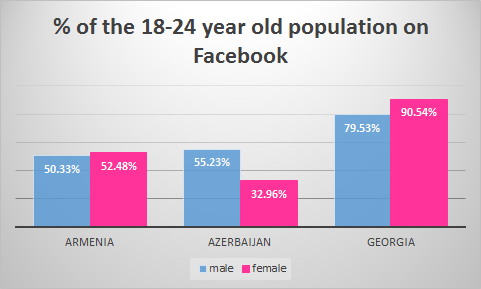
EDIT: THIS SHOULD BE 15-24 YEAR OLDS!
Wow Georgia! Most Georgian young adults are on Facebook, no doubt about that. About half of Armenian young adults and for Azerbaijan 55% of male young adults and a third of female young adults.
I also looked at the 13-18 year old users on Facebook, but I can’t compare them to the total population of 13-18 year old males and females in these states because I don’t have the data from the WorldBank. But here are the raw numbers and the ratio of male to female.
|
Armenia |
Azerbaijan |
Georgia |
| ages 13-18 |
124000 |
300000 |
240000 |
| male 13-18 |
62000 |
190000 |
114000 |
| female 13-18 |
62000 |
112000 |
124000 |
| male/female |
1 |
1.696429 |
0.919355 |
And here are the raw numbers for 18+, which I can’t analyze by age category because I don’t have the WorldBank data to compare, and the ratio of male to female.
|
Armenia |
Azerbaijan |
Georgia |
| ages 18+ |
480000 |
1140000 |
106000 |
| male 18+ |
240000 |
740000 |
480000 |
| female 18+ |
240000 |
420000 |
560000 |
| male/female |
1 |
1.761905 |
0.857143 |
Those ratios in Azerbaijan are notable.
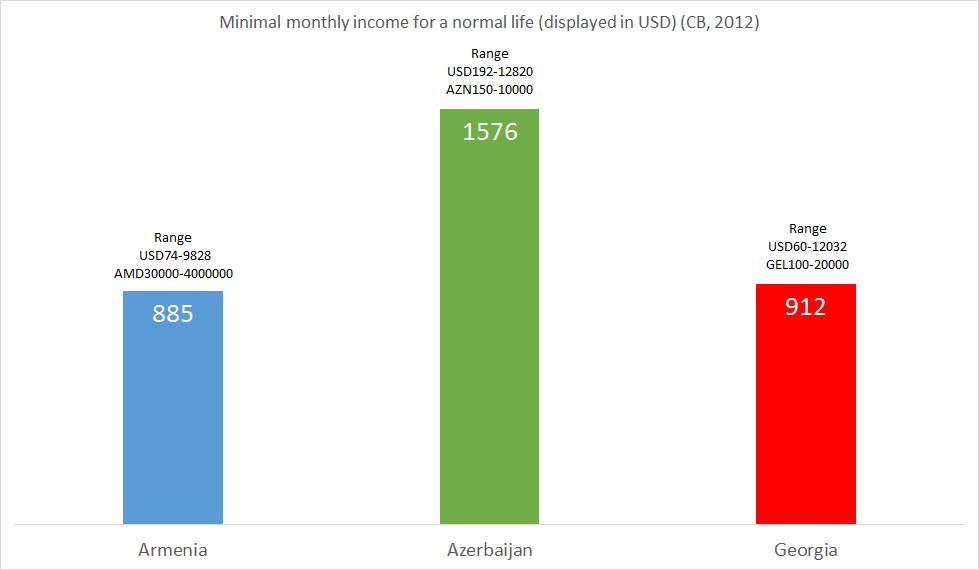
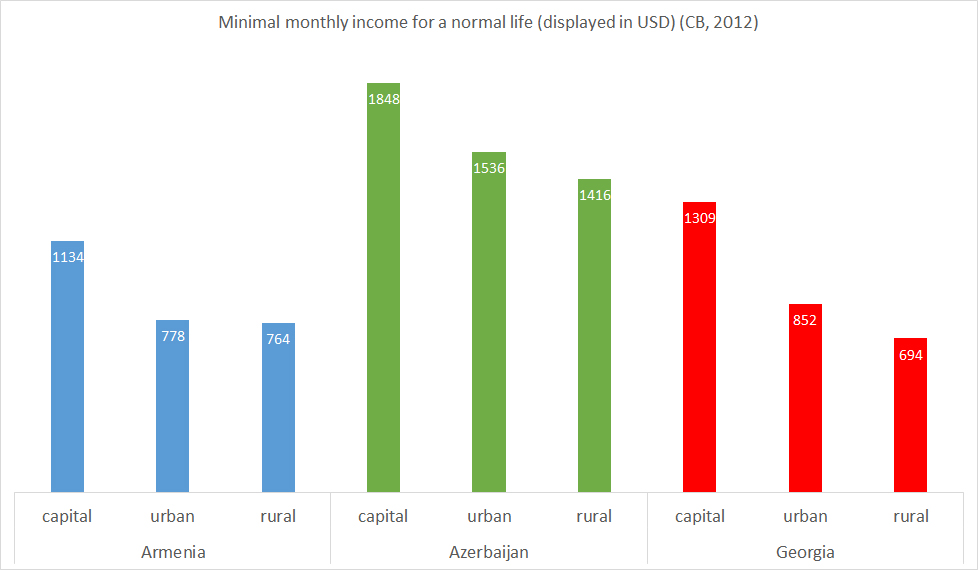
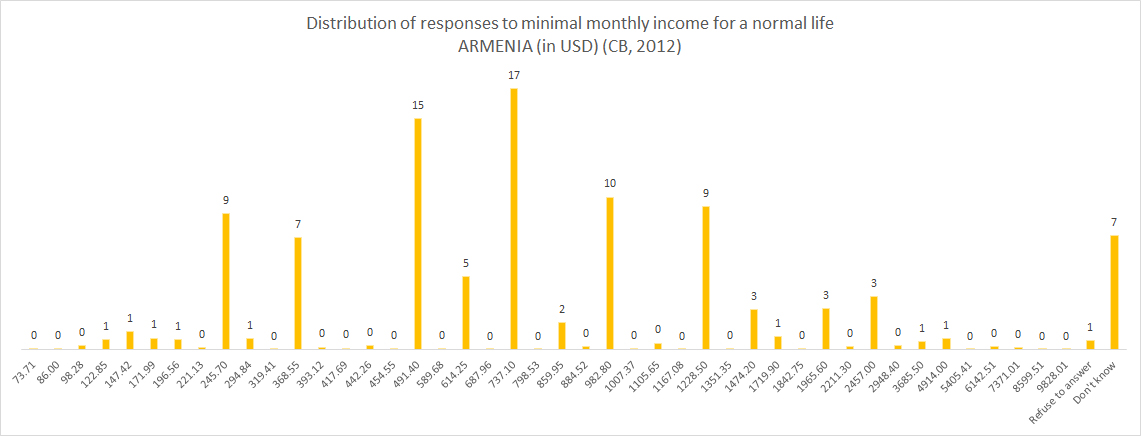
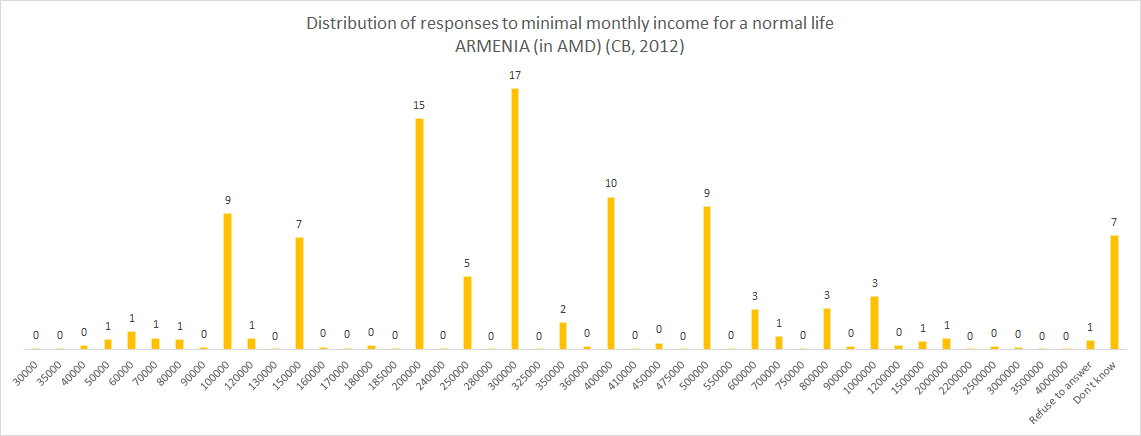
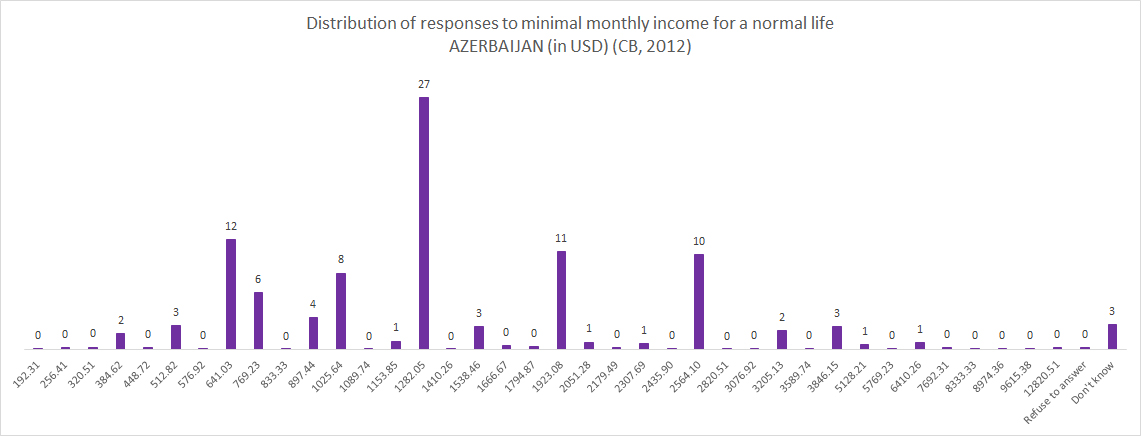
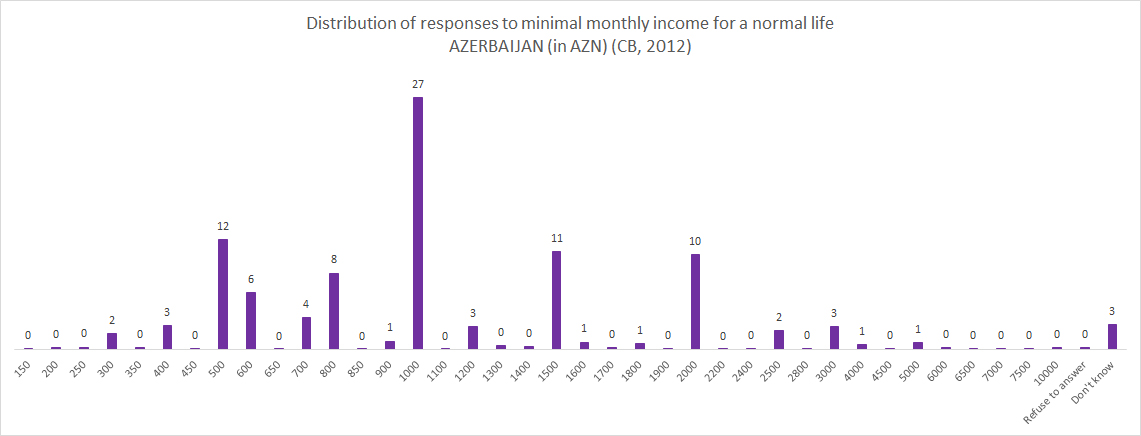
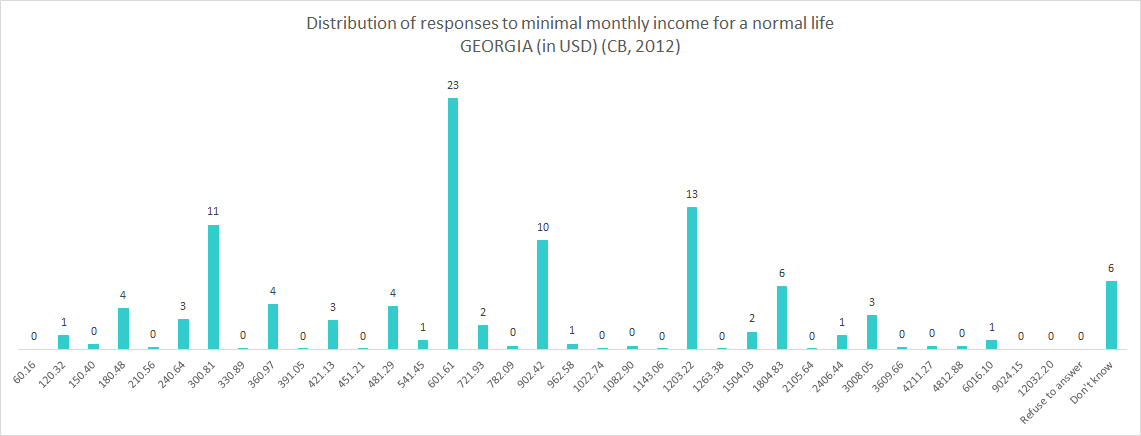
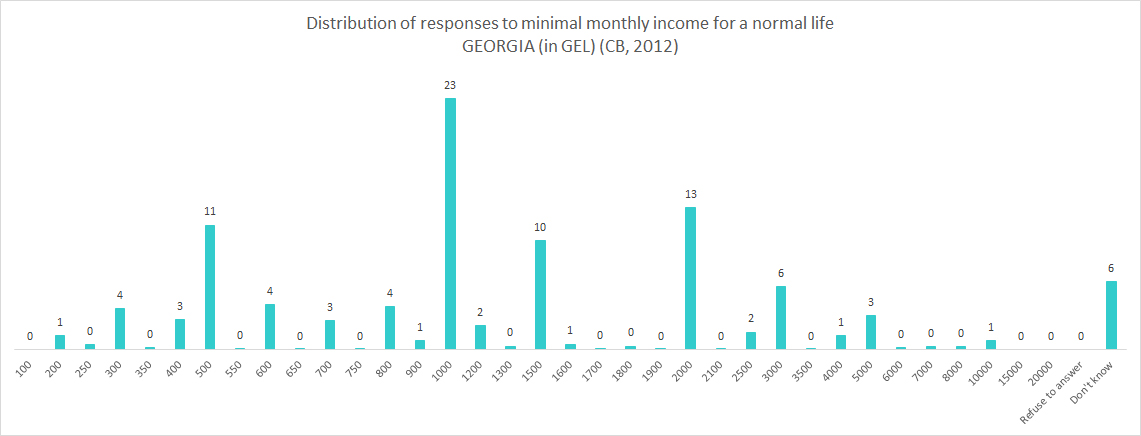
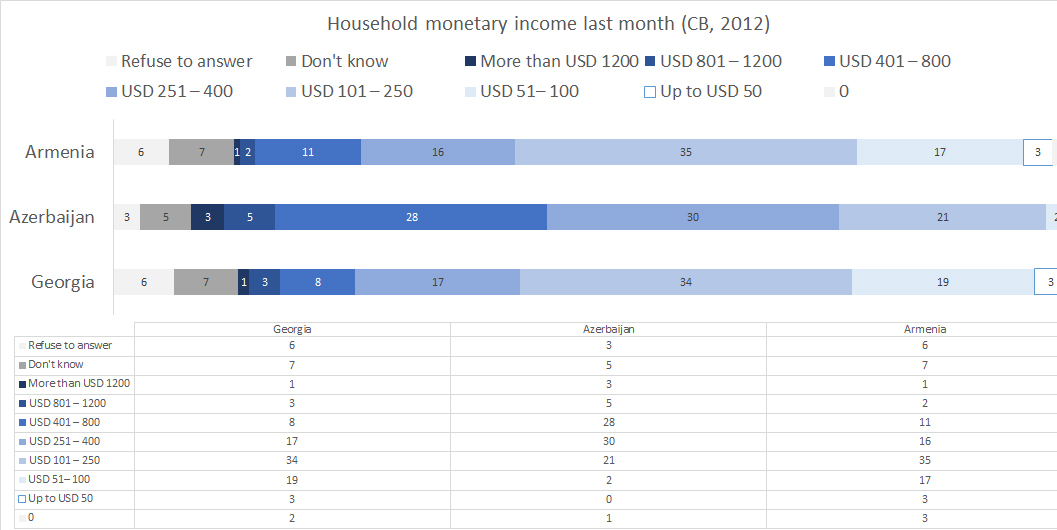
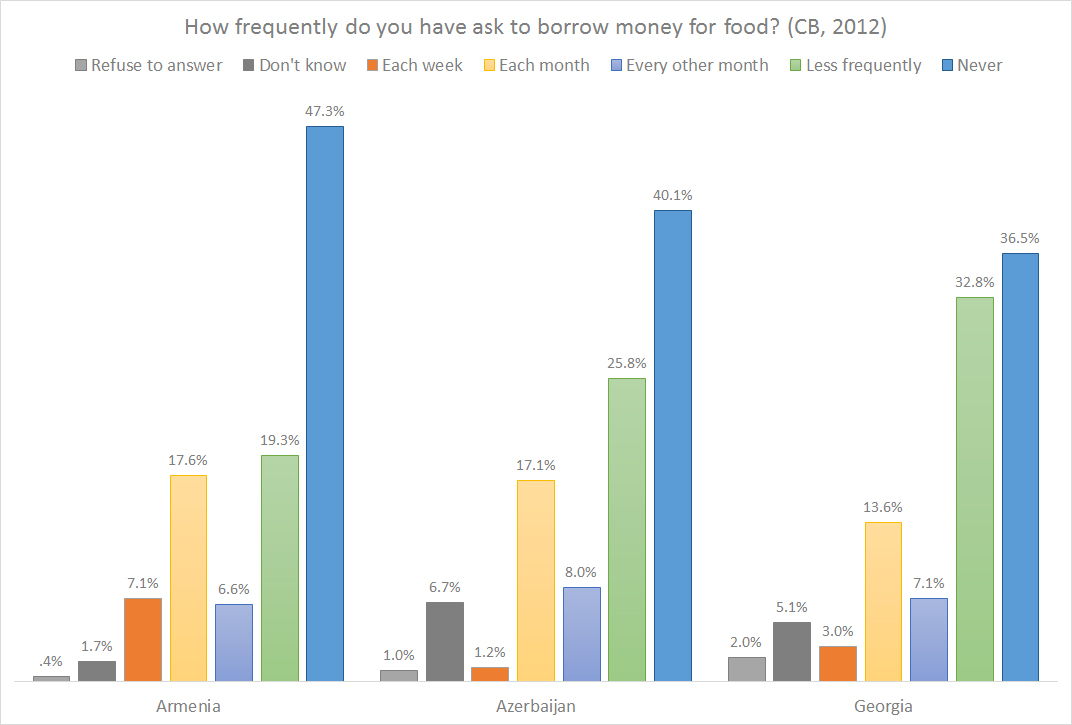
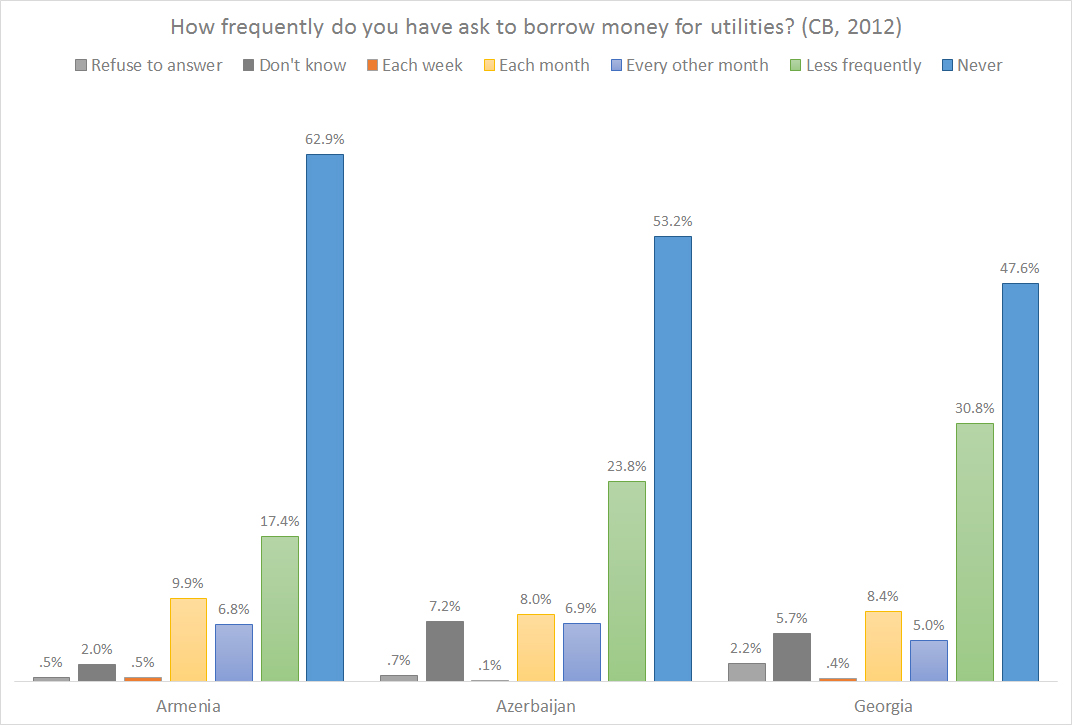
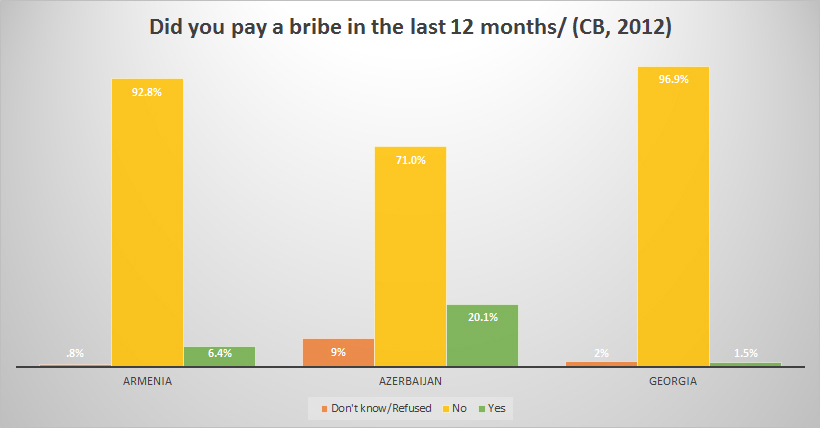
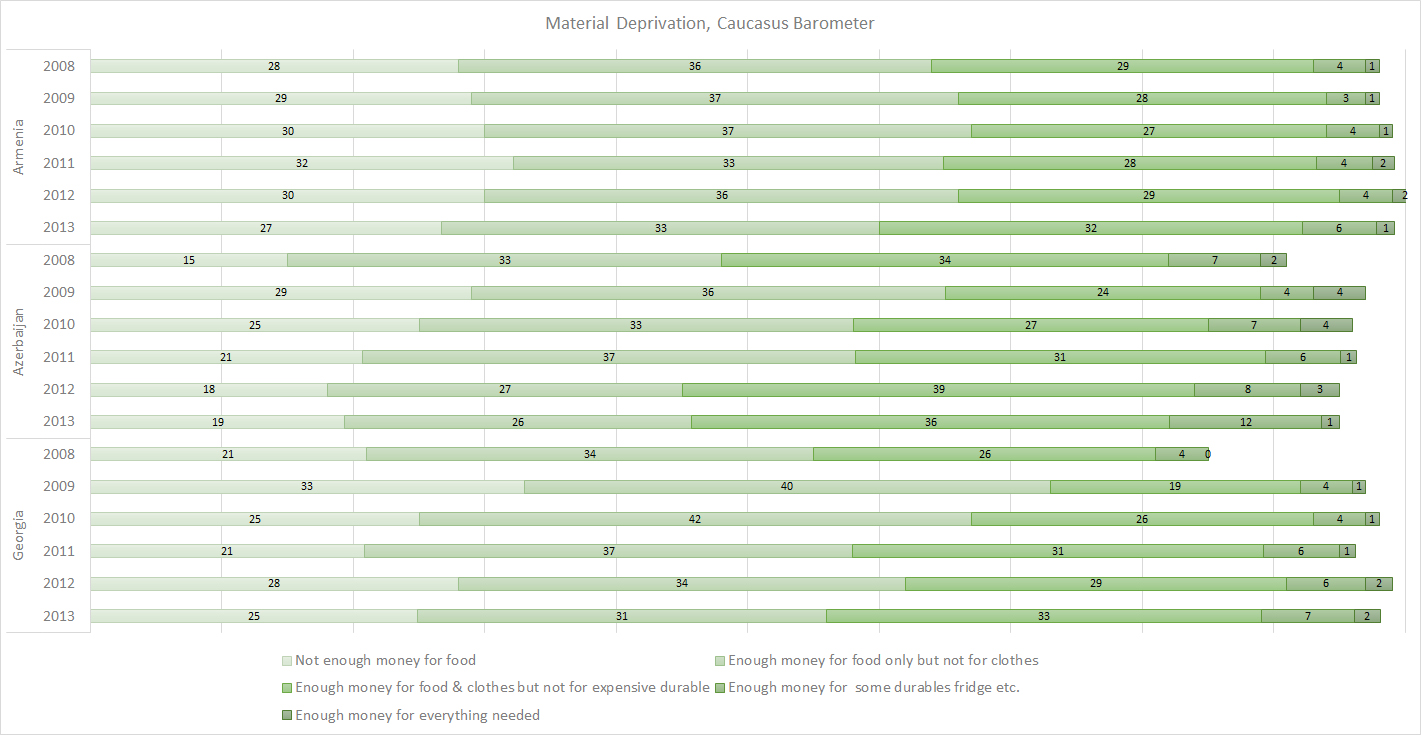
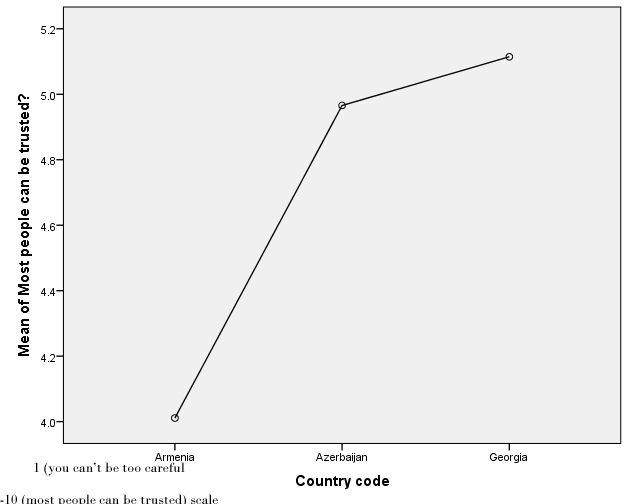
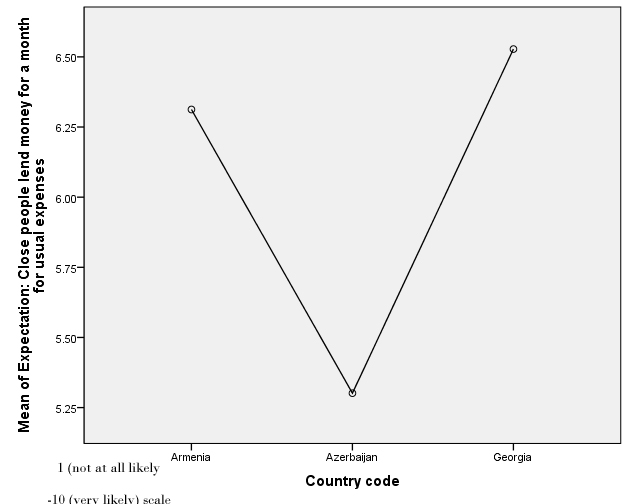
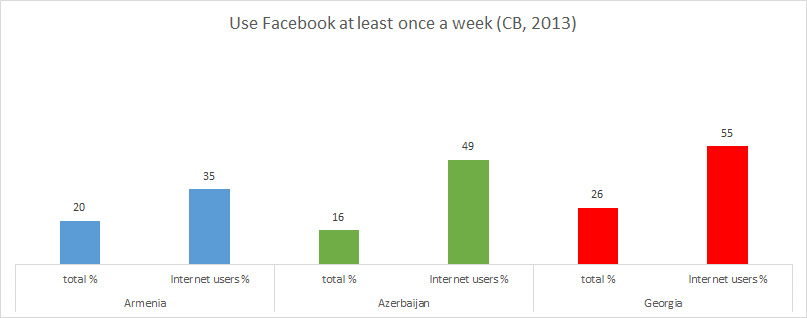
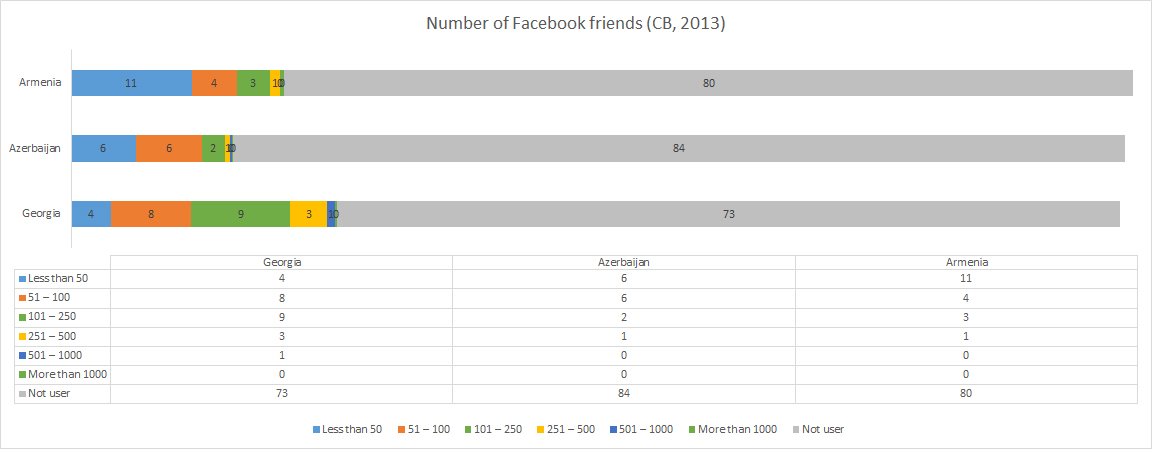
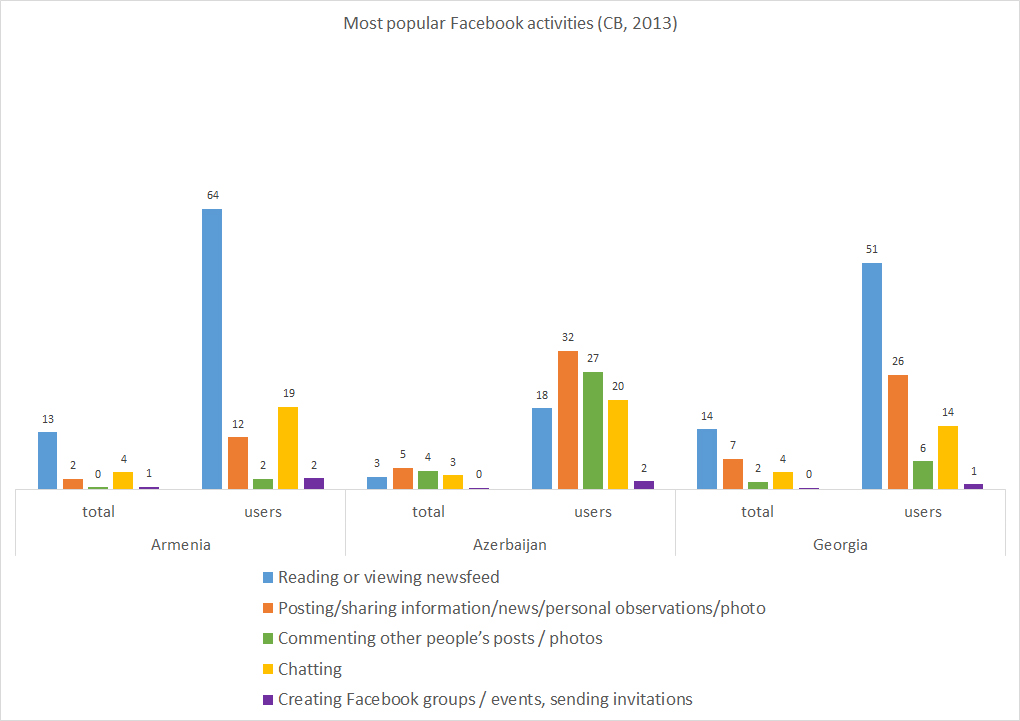
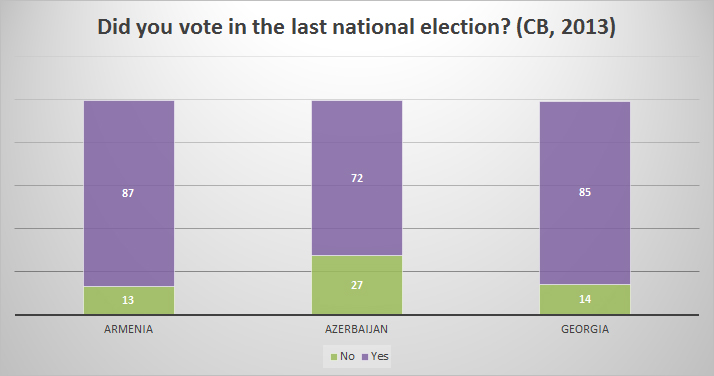
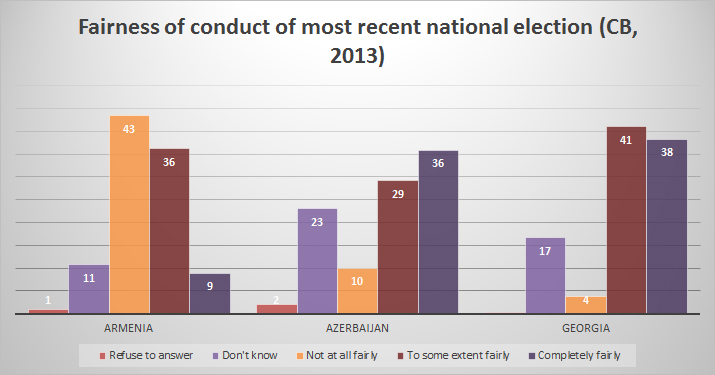
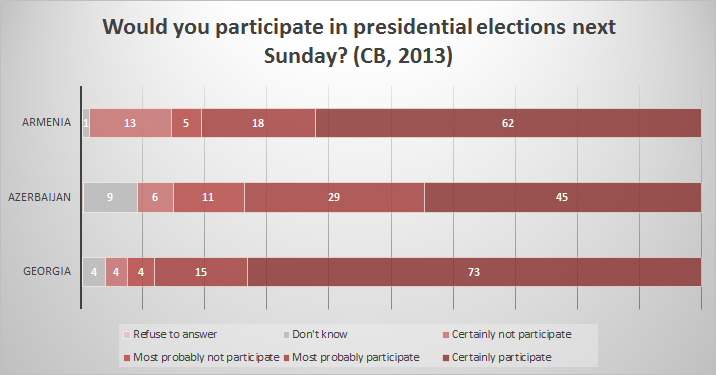
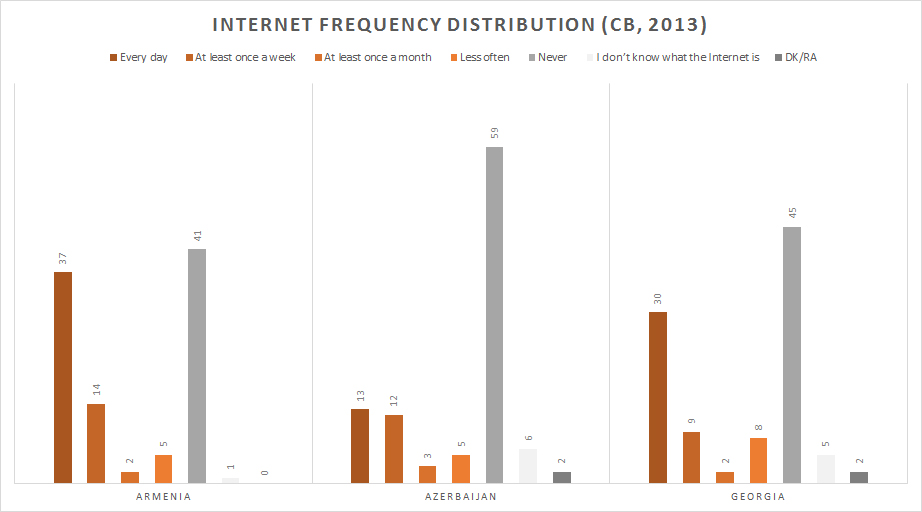
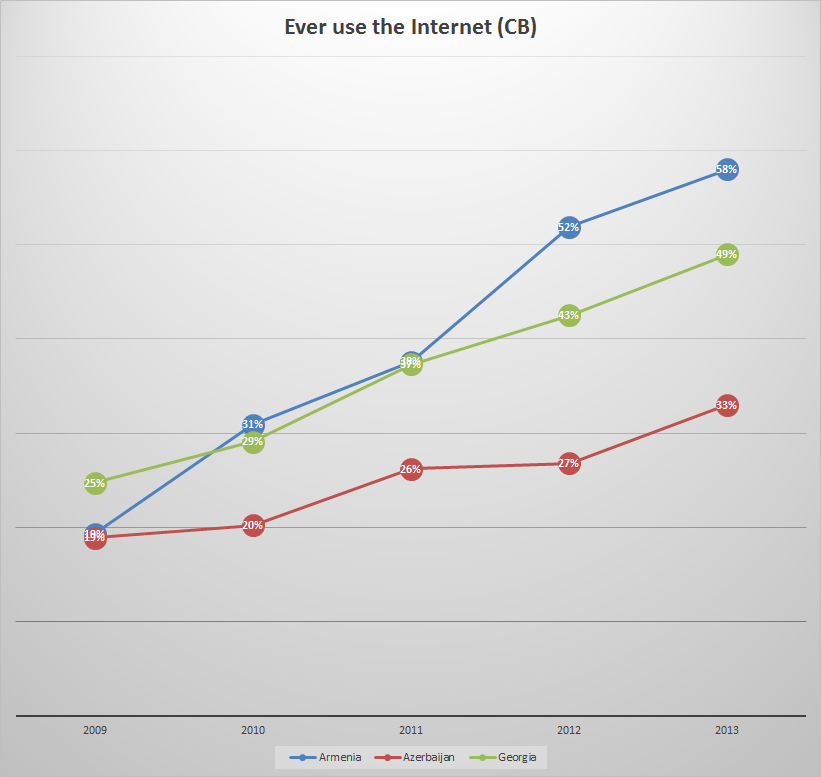
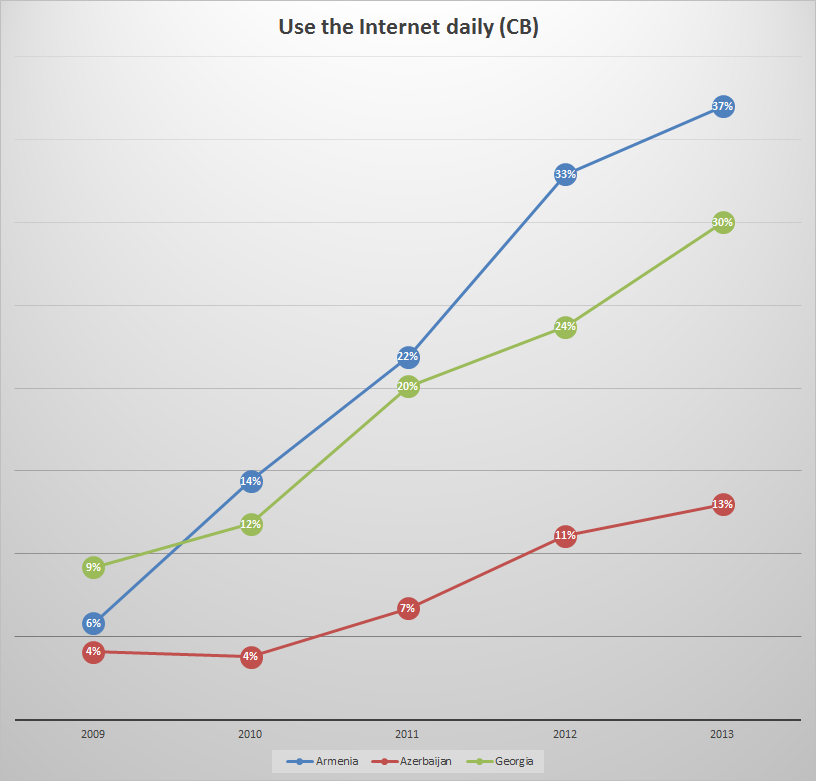
For comparison, here’s Caucasus Barometer derived information from 2012.

 (January)