06 Jan

IDPs and religiosity

ISIS/L is on everyone’s minds nowadays. Some people are concerned that IDPs in Azerbaijan are especially vulnerable to ISIS recruiting because of their marginalized position in society. (I did a blog post on attitudes toward IDPs in Azerbaijan in 2013.)

Some colleagues asked if there was any evidence that Azerbaijani IDPs are more likely to be Sunni or Shia and how religious they are. I took to the 2011 Caucasus Barometer (the most recent that asked about IDP status) and looked at IDPs versus non-IDPs and religion.

I should mention here that measuring religiosity is incredibly difficult and especially so in post-Soviet societies where there is a complicated historical blip, so to speak. With religion being suppressed during the Soviet period, certainly some religious actions were lost. As such, one needs to look at a variety of measures of religiosity. Robia Charles has some great work on this here and here.

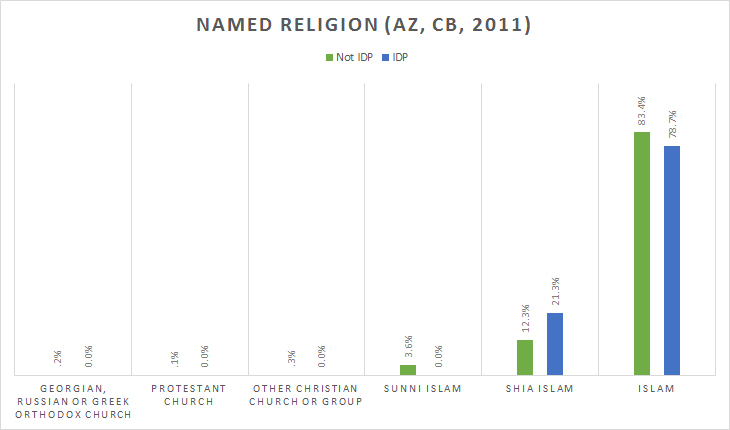
Respondents were asked to name their religion.

This is for official IDP status. Note that most respondents named “Islam” not Sunni and Shia Islam as their religion. Also there are slightly more respondents saying Shia within the IDP population than the non-IDP population. 6% isn’t a huge different though. And, importantly, no IDPs (in this sample) said Sunni Islam. This isn’t surprising given that IDP regions are traditionally Shiite anyway.

namedreligion

I looked at other measures of religiosity including self-report, frequencies of fasting, attendance of religious services, importance of religion in life and differences between IDPs and non-IDPs, and then Sunni/Shia/Islam IDPs and non-IDPs were quite insignificant. There were small thinks like IDPs are less likely to fast, but hey, IDPs also might have greater hunger problems, right?

This is by no means a sample of the entire IDP population and I’m certain that there is great variance among IDPs. But this analysis shows that IDPs being more likely to be Sunni is erroneous at least.

03 Jan

January 2015 Facebook use in Armenia, Azerbaijan, and Georgia – according to Facebook

This is an update to this post from January and this post from March and this post from September.

It is hard to know how many people in a country are using Facebook, but through Facebook’s Ad selling program, you can get some rounded information. The numbers they give are not exact, so these percentages displayed below are not accurate for the true number of users. THESE RESULTS MAY NOT ADD UP TO REASONABLE 100%S. I calculated everything from the actual population. So when it says 36% of Georgian women are X, I calculated from the population data from the World Bank. This isn’t SOLID information, but it does come FROM Facebook, so it is a little bit better than SocialBakers.

This is what it looks like to find out this information:

facebook

So, Armenia has 2,974,184 people, Azerbaijan 9,590,159 people, and Georgia 4,555,911 people total according to the World Bank and after I subtracted those age 0-14 (World Bank’s category, not mine) the populations are Armenia: 2,460,436; Azerbaijan: 7,419,487; Georgia: 3,855,233.

Facebook Ads says that this many people in each of those countries is a potential viewer of their ads (thus a Facebook user): Armenia: 580,000 (in January) 620,000 (in March) 680,000 (in September) 740,000 (in January 2015) ; Azerbaijan: 1,320,000 (in January) 1,380,000 (in March) 1,460,000 (in September) 1,460,000 (in January 2015); Georgia: 1,220,000 (in January) 1,280,000 (in March) 1,380,000 (in September) 1,500,000 (in January 2015).

Thus, here are the percentages of the age 14+ populations of each country who are on Facebook:

a(January)a2

14plussept

january20`5total

Armenia: 30%
Azerbaijan: 20%
Georgia: 40%

So that is interesting, but let us look at gender differences (I took the direct gender population data from the age distribution tables – this is not 50/50, but more accurate).

And let’s look at this over a year.

year14

Lots of growth in Armenia and Georgia and some in Azerbaijan.


b(January)b2

popsept

totalpop

Armenians and Georgians are evenly distributed gender-wise on Facebook. And Azerbaijanis, well, this gender difference is shown in a lot of other research.

c(January)c2

gendersept

gender

In terms of the balance of users, Armenians are fairly even, Georgians have a bit more women and you can see that about 2/3rds of Azerbaijanis on Facebook are men. Although this may seem shocking, this is much better than it has been in previous years.

d(January) EDIT: THIS SHOULD BE 15-24 YEAR OLDS!

d2

distrosepy

14yearolds

Wow Georgia! Most Georgian young adults are on Facebook, no doubt about that. About 60% of Armenian young adults and for Azerbaijan 60% of male young adults and a little less than a third of female young adults.

For comparison, here’s Caucasus Barometer derived information from 2012 and 2013.

I added a new measurement this quarter – looking at language use. I assume that Facebook is deriving this information from the language that a user chooses as their main Facebook language – not what they’re typing in. Although, I’m not sure about this. Facebook gathers a lot of data about its users and it could autodetect the language that the person uses. Also, I have no idea if these contain multiple languages. There could easily be users that use two languages equally. And also certainly this doesn’t detect transliterated languages.

But, not all language choices are available in the Facebook ad system. I’m sure lots of people use Armenian, Azerbaijani, and Georgian for their Facebook platform.

language

This makes sense to me, but what’s going on in Georgia? I assume that this empty space is Georgian.

I wish that I knew more about how they calculate this, but it is interesting nonetheless.