23 Nov

I Got 99 Problems, But Statistical Triangulation Ain’t One

I often have conversations with people about Internet penetration rates.

The point I’d like to make is that these statistics are complicated and it is hard to get at the “right” number. That’s why we try to triangulate — look at different sources of data to see if things seem right. We also should always assess the credibility of the source of the data.

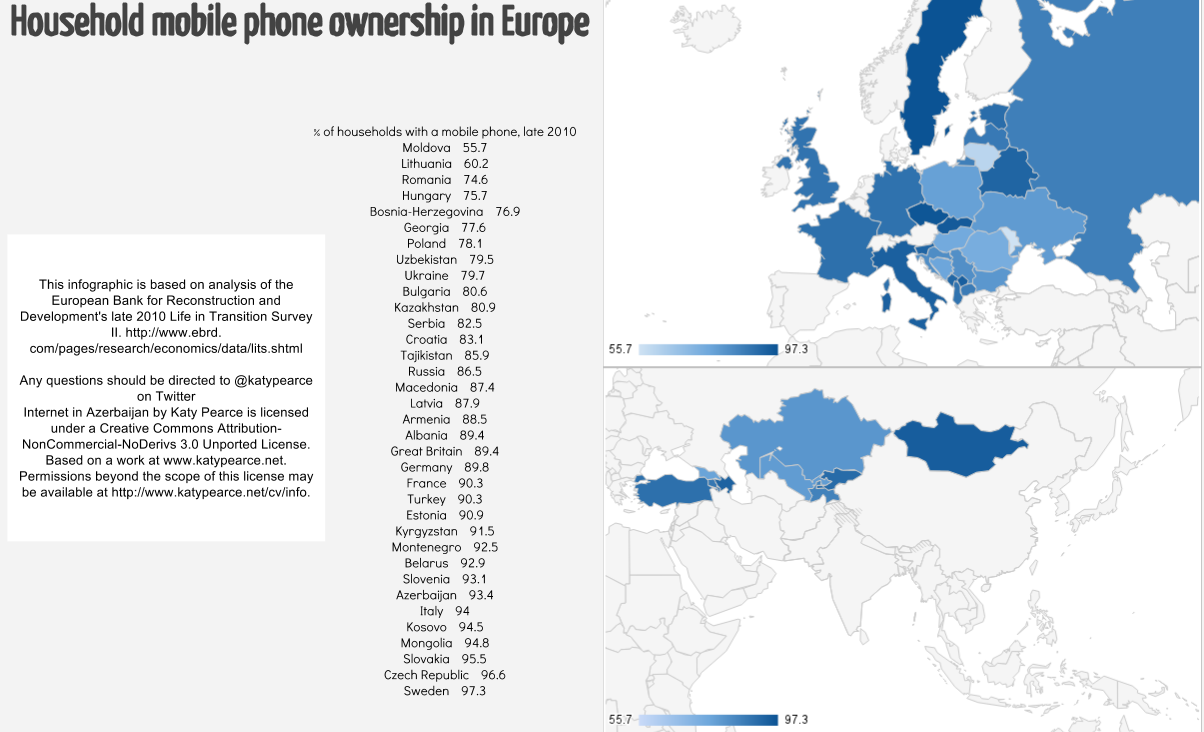
For this example I chose mobile phone penetration.

Data sources:

ITU is the UN’s official statistics and these numbers come from the governments themselves who usually get the numbers from the telecommunications companies. These companies count number of SIM cards sold and it is not unusual for people to have multiple SIM cards. This is data to be highly skeptical about.

Caucasus Barometer, Gallup, and EBRD are surveys taken face-to-face in households. All use different sampling techniques and are collected by different organizations. None are perfect, but they’re as good as we’ve got. Of the three, I trust Gallup the least.

Noteworthy:
All of these were collected at different times of the year.

Margin of error varies in all of these.

A ~4-6 point difference is within the margin of error and shouldn’t be looked at with too much suspicion.

So what do we see?

– Look at the huge difference between the ITU and the Caucasus Barometer in all three countries in 2004.
– 2006 is a little better, but Georgia’s a little too far off to be left to chance.
– 2007 is a little questionable in both Armenia and Azerbaijan.
– 2008 is really off in Armenia and not great in Azerbaijan.
– 2009 isn’t bad.
– 2010 is all over the place. My thought is that by the time you’d are at more than three-quarters of households having phones, the ones that don’t are also probably the ones that are less likely be be surveyed – the poorest of the poor, for example.
– The 2011 difference between the CB and the ITU is likely due to SIM counting. While a household may own a phone, they may have a lot of SIMs too.

20 Oct

Does political affiliation matter for Twitter use?

My friend PJ Rey tweeted that it appeared, based on Pew Internet data, that Democrats were 50% more likely (18%) to be on Twitter than Republicans (12%).

But, I tweet-pleaded with him, Democrats are younger, amongst other important sociodemographic differences, and that was likely to explain the differences. I then made my usual call for multivariate analysis.

INTERNET USERS ONLY (with missing values of refused and don’t know removed):

First, about Twitter use — 8.2% of all people (in this sample, American adult Internet users) used Twitter yesterday and 6.7% used Twitter (but not yesterday), and 84.8% do not use Twitter. So already we’re dealing with a pretty small group.

But that being said…

Regarding political party affiliation,

Used Twitter yesterday:
5.4% of Republicans
11.4% of Democrats
7.9% of Independents

Used Twitter, but not yesterday:
5.5% of Republicans
9.1% of Democrats
6.8% of Independents

And yes, these are statistically significant differences.

When asked about party leaning (more toward Republican or Democrat)

9.5% of those leaning Republican used Twitter yesterday; 7.9% of those leaning Democrat used Twitter yesterday

7.2% of those leaning Republican used Twitter, but not yesterday; 9.0% of those learning Democrat used Twitter, but not yesterday

These were NOT statistically significantly different.

Then asked about ideology (very conservative, conservative, moderate, liberal, or very liberal)

Used Twitter yesterday:
7.8% of very conservative; 6.0% of conservative; 6.7% moderate; 13.4% liberal; 10.8% very liberal

Used Twitter, but not yesterday:
3.8% of very conservative; 6.3% of conservative; 7.9% moderate; 6.7% liberal; 10.8% very liberal

Statistically significant differences here again.

But let’s recall that people aren’t randomly distributed into different political leanings.

And yes – Twitter use varies significantly by income level, educational attainment, race, and age.

So in a multivariate analysis (that means everything’s thrown into the stew), do various political affiliations matter?

For party (this was the one that included independent), no, this did not matter (although it was fairly close to being statistically significant), income and age were the major explanatory variables for Twitter use.

For party line (leaning Democrat or Republican), no, this did not matter – in this case, age, followed weakly, but still statistically significantly, by income, were the primary explanatory variables for Twitter use.

For ideology (that’s the conservative-liberal one), no, this did not matter – in that case income and age were the major explanatory variables for Twitter use.

Link to full image