Azerbaijan and gender imbalance: what the 2023 MICS birth histories show


I’ve done a few projects discussing son preference in Azerbaijan. And recently I was doing a little cleaning up and took a look at the 2023 UNICEF Multiple Indicator Cluster Survey – which was carried out by the Azerbaijan State Statistical Committee in collaboration with UNICEF.
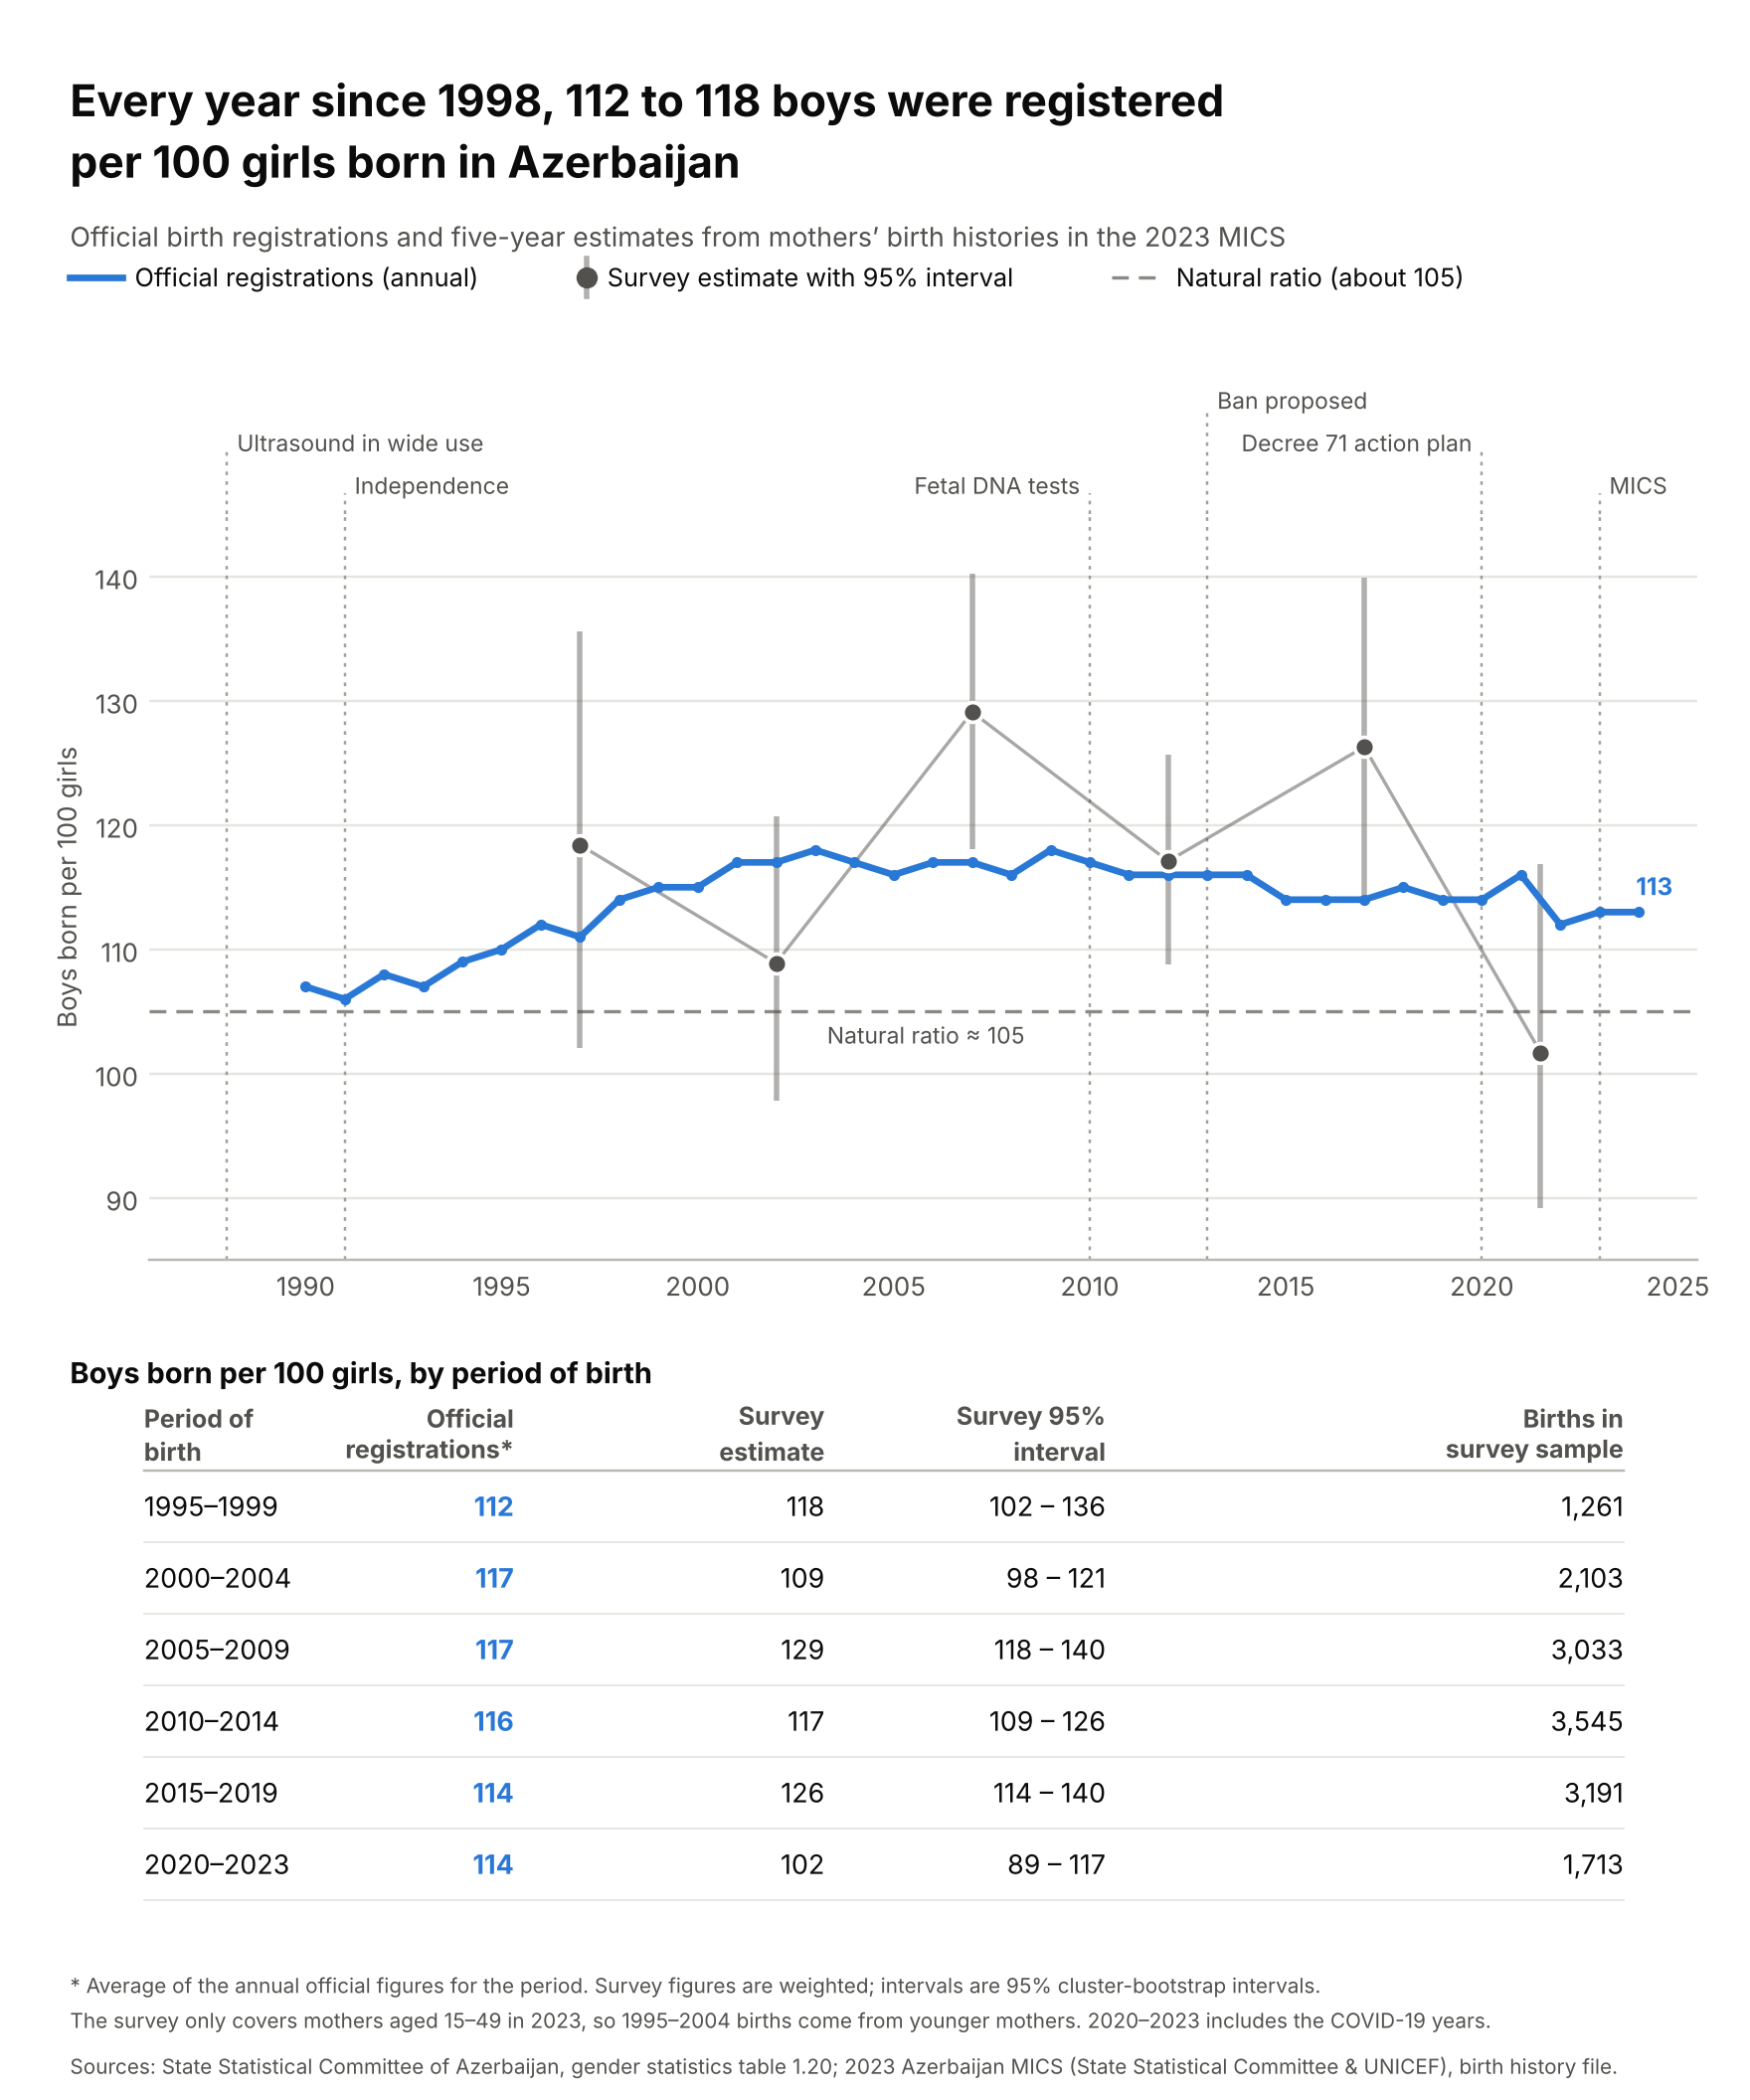
What’s particularly interesting is that this is self-reported data from mothers recalling their own births. Overall, it lines up with the official figures, but it can show something registration data can’t: what happened depending on the sex of the children a family already had. Without intervention, about 105 boys are born per 100 girls. Across all the births these women reported, it was 118.
A bit of background about the survey: Between May and August 2023, interviewers completed questionnaires in 10,817 households and completed interviews with 8,924 women aged 15 to 49. The anonymized microdata are free to download from UNICEF after registration. Each woman who participated gave a full birth history: every live birth, its month and year, the child’s sex, and whether the child is still alive. That history yields 15,113 births going back to the early 1990s. Because it records the order of births and the sex of the children before each one, it shows not just how many boys were born but which families had them. Also, importantly, the MICS survey only includes women aged 15-49 in 2023, so births from the 1990s come from younger mothers. The survey’s estimate for 2020–2023 (102) is low, but official registrations for those years don’t show that dip, so I’d treat it as noise from the COVID years and a smaller sample.
It is important to ask why there is such an imbalance and also to contextualize things. There is a lot more background about this in those papers linked above, but briefly, during the Soviet period, non-medical abortion was a very common contraceptive method, especially with modern contraceptive methods being difficult to come by. Today in Azerbaijan, abortion is available up to 12 weeks. Further, in the late 1980s-early 1990s, ultrasound technology became more widely available, and it became more common for people to have early ultrasounds and sometimes have sex selective abortions. Around ~2010 or so blood tests that detect fetal sex from fetal DNA became available, providing an additional avenue for sex selective abortions.
In terms of policy, while in the late 2000s to early 2010s, there was drafted legislation discouraging various fetal sex determinations (like sex selective IVF, not telling parents fetal gender, etc.), but nothing passed, although in 2020 there was an “action plan” government decree. In the 2010s, the Azerbaijani government and UNFPA did a series of studies on gender imbalance. Notably, the Azerbaijani UNFPA country office closed in 2025.
This table below (labeled 1.23) is from the State Statistical Committee’s site and shows that there is a broader pattern of 108:105 for first births, 112:109 for second births, 144:136 for third births.

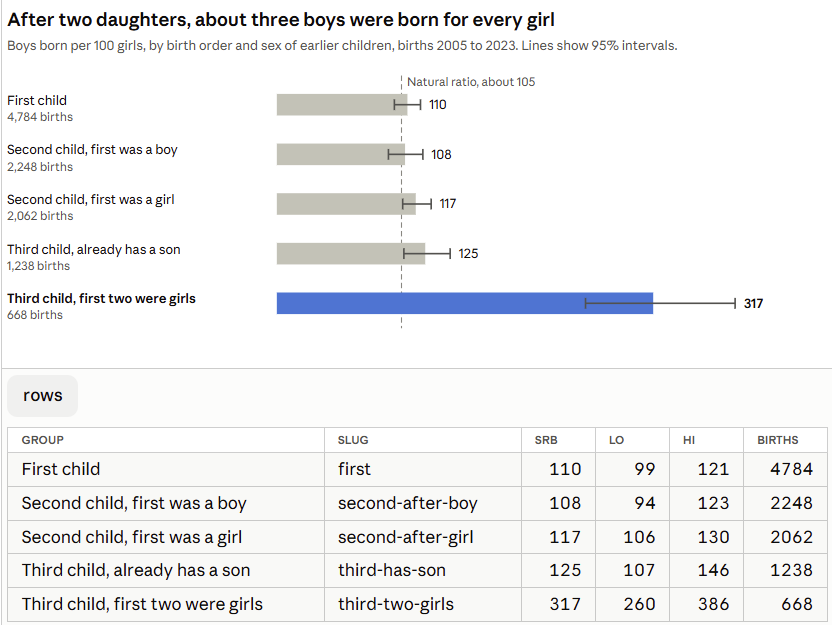
So while that is indeed interesting, what the 2023 MICS data allows us to see, is how this plays out depending on the sex of the children born previously. The chart below (After two daughters, about three boys were born for every girl) is from my analysis of the entire dataset 2005-2023. From it we can see that among women who had had a second child 5+ years before they answered this survey, 75% of those with 2 daughters eventually had a third child. But for women with at least one son, only about 40% of had a third. Thus, trying for a boy explains why these families went on to have more kids. And with those third children born, again, remember that it should be something like 105:100, but for those third children in this dataset, it was 317:100 – like 3 boys for every 1 girl! That is consistent with sex selective abortion.
I also made a version of this that is 2011-2015, below “Around 2013,…,” just to get a sense of how things looked during that period of a lot of public discussion.

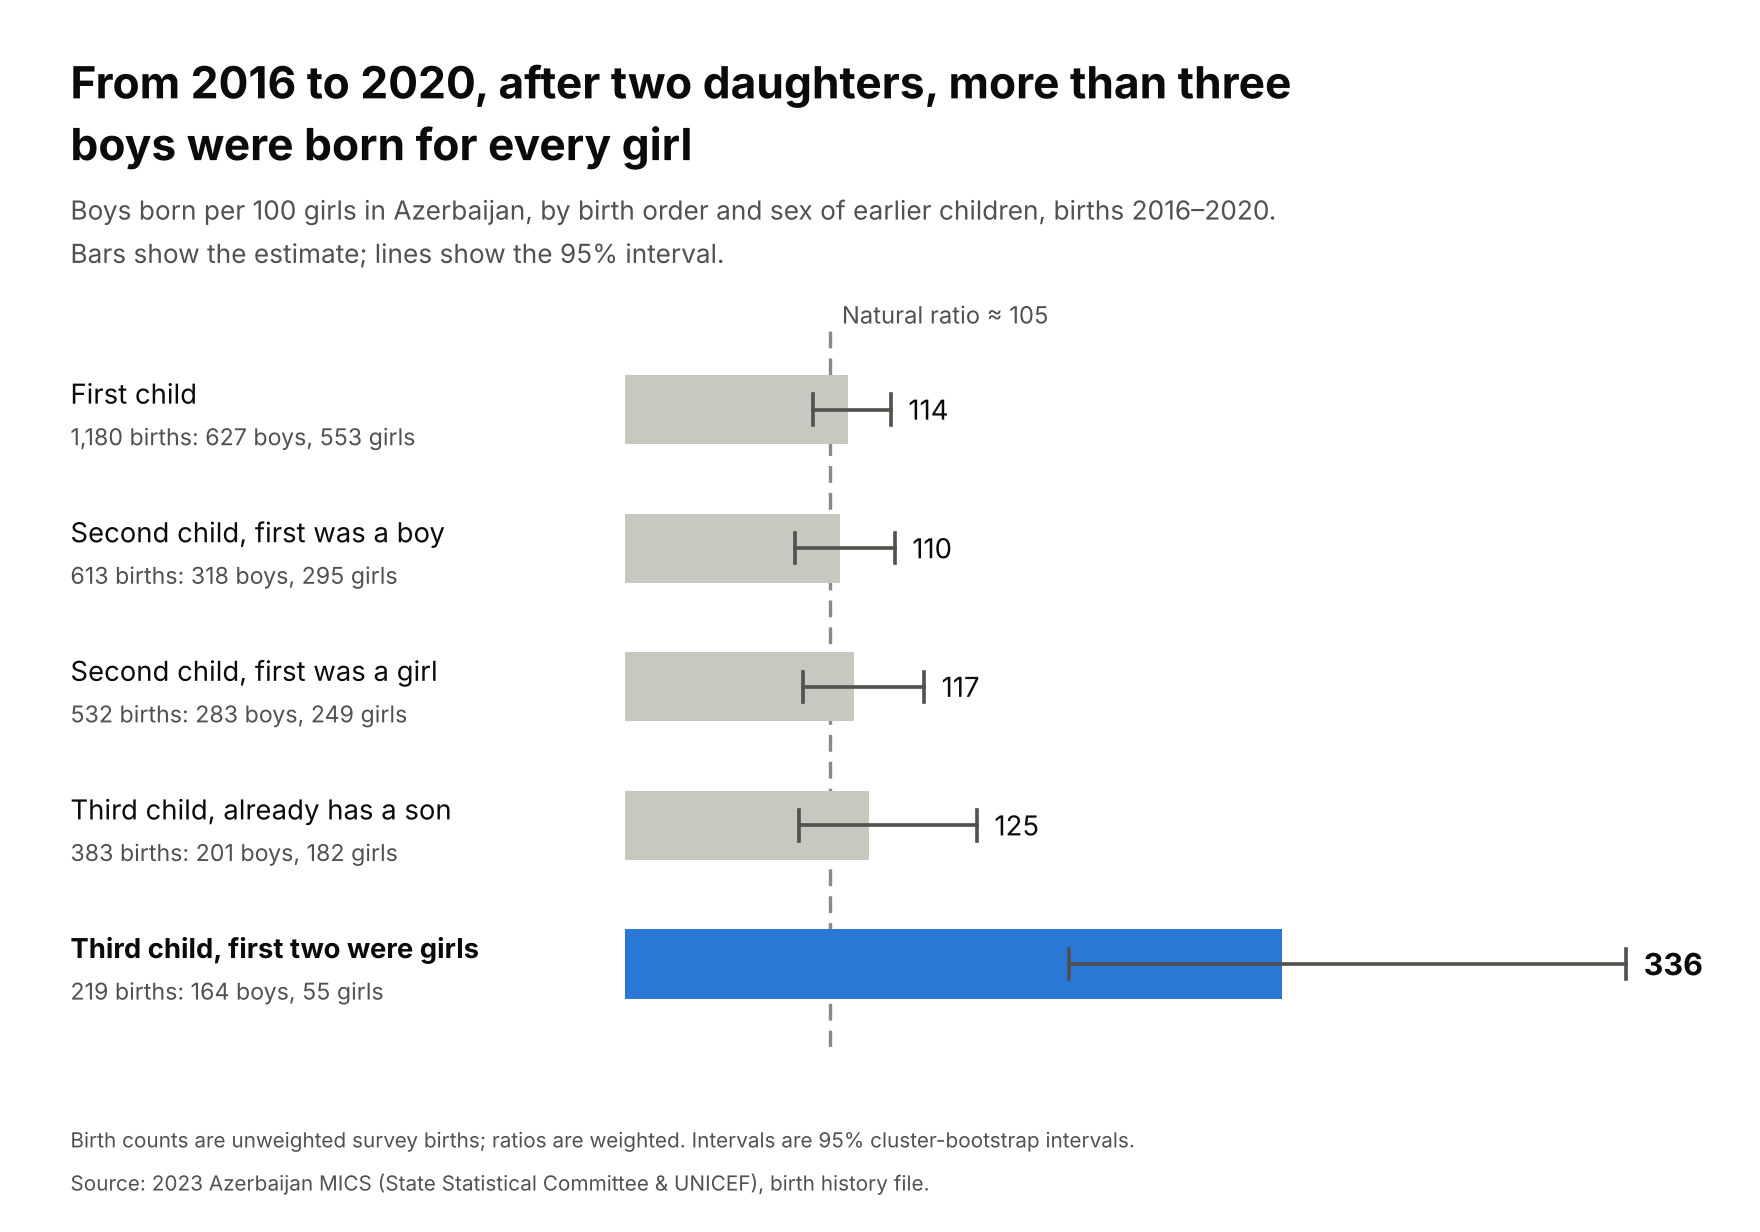
I also was curious as to what things looked like closer to 2020 when the new initiative came through, see the chart below “From 2016 to 2020….”.
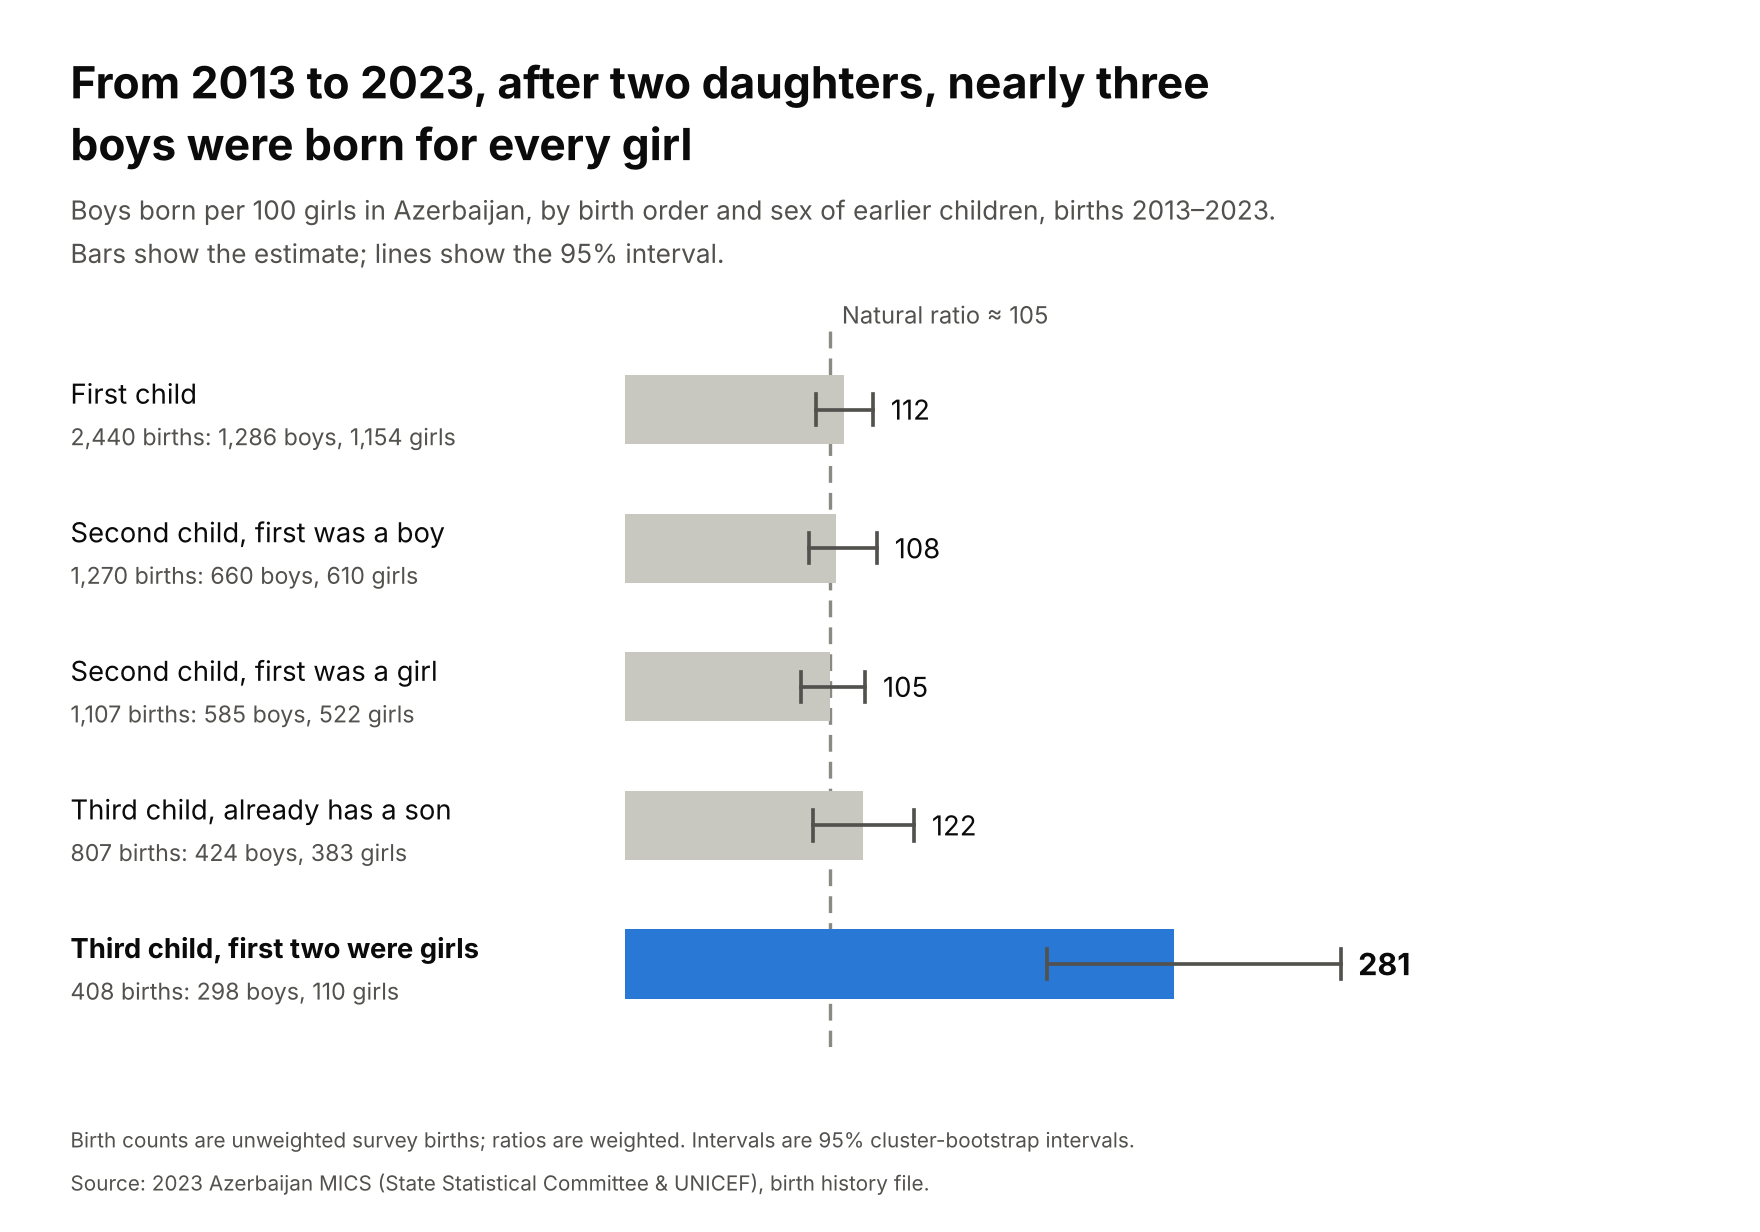
Also, again, just for comparison’s sake, here’s 2013-2023, in the chart “From 2013 to 2023” – so just the more recent years.
This is a chart, “Every year since 1998…” that I made combining the official registrations with what was reported in the MICS survey.