I do a lot of social media analysis. What does this mean?
What is a social network analysis? Via Wikipedia:
Social network analysis (SNA) is the methodical analysis of social networks. Social network analysis views social relationships in terms of network theory, consisting of nodes (representing individual actors within the network) and ties (which represent relationships between the individuals, such as friendship, kinship, organizational position, sexual relationships, etc.) These networks are often depicted in a social network diagram, where nodes are represented as points and ties are represented as lines.
And NodeXL is a free tool that works with Microsoft Excel to create interactive network visualizations. It is fairly easy to use once you get used to it.
So with this program, you can see who follows whom on Twitter, who replies to each other, etc. And then it shows this all visually.
Marc Smith did a great job with this slide deck explaining it here.
A network is a collection of things that are connected to one another.
By looking at the network, we can see the relationships between members – clusters of people, who is important, who is connected, how the relationships change over time. Some of this stuff is intuitive – like popularity or influence, but network analysis can go deeper. For example, how many of your friends know each other? Are there network members that are bridges between groups?
We visualize the network and use symbols and colors to show patterns.
—
Social media is cool because it gives us a TON of data – not only content, but connections. We can collect, analyze, visualize, and make inferences on these connections.
—
Social network analysis tl;dr:
Nodes are actors.
Edges are connections.
Centrality is the number of direct connections that individuals have with others in the group.
Cohesion is the ease with which a network can connect – short paths between nodes.
Density is the number of connections.
Betweenness is the shortest path between two nodes.
We can also know attributes of nodes – when did they join Twitter? How old are they? And map this onto the visualization.
—–
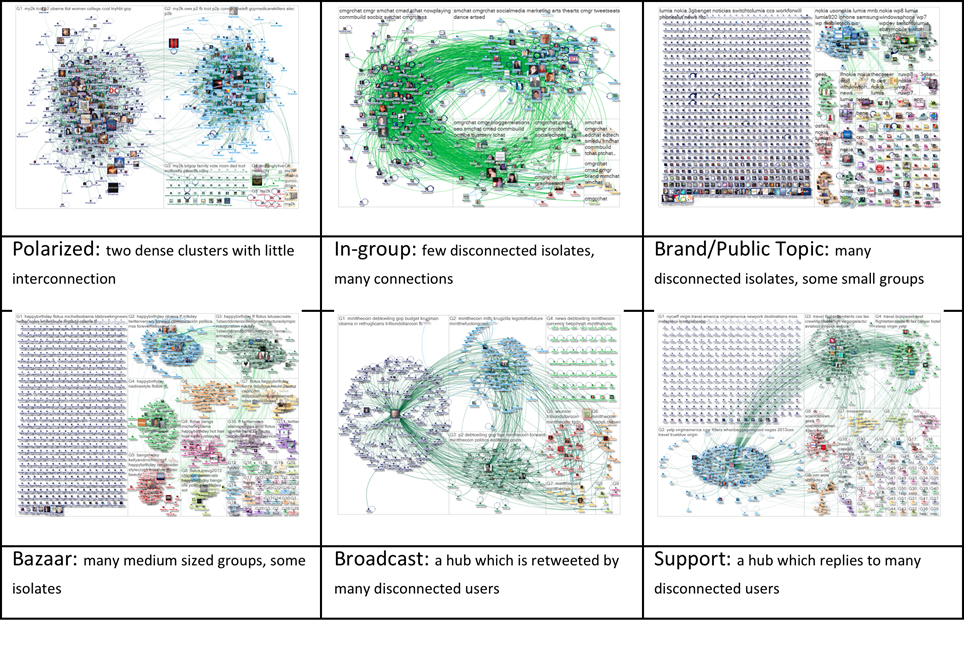
There are 6 types of networks (graphic via Marc Smith)
So why am I doing this?
- I am a social scientist. I like seeing patterns in things and I believe that this sort of modeling can add to understanding.
- I have the resources (time, computing power, skills) to do this.
- I like making analyses accessible to people that don’t have the skills that I do.
- I believe that information (to some extent) should be free. Moreover, I imagine that people in power have tools to understand networks like this and giving this information to everyone is more egalitarian.
- This information (social media data) is already out there in the world, just not organized in this way.
- I believe in freedom of expression. I am deeply sad that there is little freedom of expression in Azerbaijan.
- If this analysis can be a tool for those supporting freedom of expression, that gives me a great deal of joy. I hope that it is not also being used as a tool of suppression, but that is the price one pays for transparency and openness.
- It is possible that at some point I will write up some of this in the form of an academic article.
- I’ve received a lot of positive feedback from those involved in these events that this analysis has been useful to them. It isn’t often that this sort of thing can have an immediate application, so this is really cool.
In the meantime, I am happy to answer any questions about this.